
MATLAB: An Introduction with Applications
6th Edition
ISBN: 9781119256830
Author: Amos Gilat
Publisher: John Wiley & Sons Inc
expand_more
expand_more
format_list_bulleted
Related questions
Question

Transcribed Image Text:GAGE MINDTAP
13 Assignment
stions Exercise 13.09 Algo (Analysis of Variance and the Completely Randomized Design)
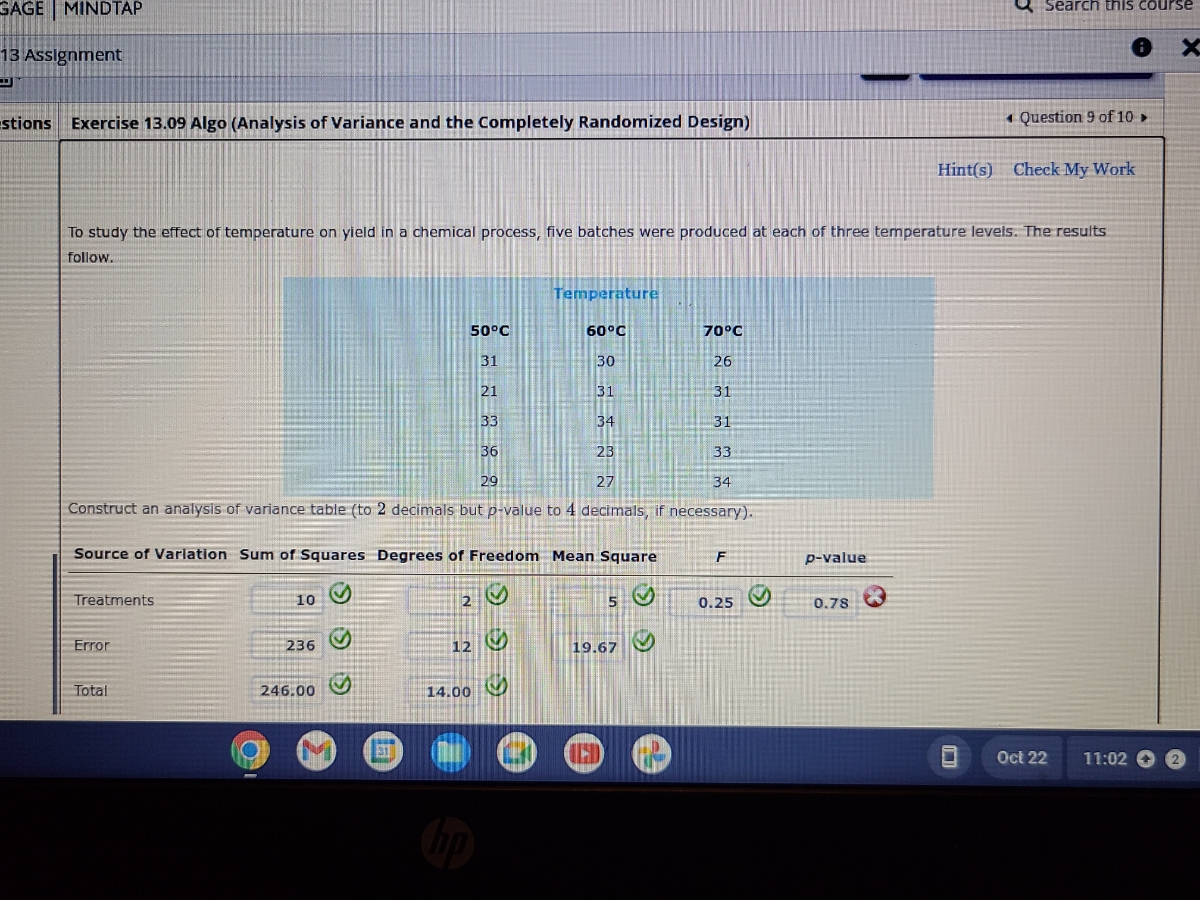
60°C
70°C
30
26
31
31
34
31
23
33
29
27
34
Construct an analysis of variance table (to 2 decimals but p-value to 4 decimals, if necessary).
To study the effect of temperature on yield in a chemical process, five batches were produced at each of three temperature levels. The results
follow.
Treatments
Source of Variation Sum of Squares Degrees of Freedom Mean Square
Error
Total
10
236
246.00
S
50°C
31
21
33
36
111
12
14.00
Temperature
hp
G
5
19.67
IND
F
0.25
p-value
0.78
Search this course
0
Question 9 of 10 ►
Hint(s) Check My Work
Ⓡ X
Oct 22
11:02
Expert Solution
arrow_forward
Step 1
Given
F=0.25 , df1=10, df2=236

Step by stepSolved in 2 steps with 1 images

Knowledge Booster

Similar questions
- What is the answerarrow_forwardMean 1001 206 Levene's Test for Equality of Variances Sig. 15.578 <.001 .510 1.402 df Sig. (2-tailed) 1205 .014 261.832 035 -3.168 -3.168 Std. Error Difference 3. Do Whites spend a significantly different amount of time on the internet (WWWHR) than Blacks? Group Statistics Std. Error Race of respondent N Std. Deviation Mean Www.hours per week WHITE 13.29) (16.124) BLACK 16.46 20.120 Independent Samples Test t-test for Equality of Means Mean t Difference Www hours per week -2.455 Equal variances assumed -2.124 Equal variances not assumed 1.291 1.492 95% Confidence Interval of the Difference Lower Upper -5.701 -6.106 -.636 -.231arrow_forwardWhat type of data are represented in the table? Univariate categorical Bivariate categorical Univariate numerical Bivariate numericalarrow_forward
- Statistics students believe that the mean score on a first statistics test is 65. The instructor thinks that the mean score is higher. She samples 10 statistics students and obtains the scores: Grades 74.4 96 83.2 65 63.9 64.3 74.4 69 68.4 88 Test grades are believed to be normally distributed.Use a significance level of 5%. State the alternative hypothesis: HA:HA: μ>65μ>65 μ<65μ<65 μ≠65μ≠65 State the mean of the sample: (Round to two decimal places.) State the standard error of the sample means: (Round to four decimal places.) State the test statistic: t=t= (Round to four decimal places.) State the p-value: (Round to four decimal places.) Decision: Reject the null hypothesis. Do not reject the null hypothesis.arrow_forwardAssume the samples are random and independent, the populations are nomally distributed, and the population variances are equal. The table available below shows the prices (in dollars) for a sample of automobile batteries. The prices are classified according to battery type. At a = 0.10, is there enough evidence conclude that at least one mean battery price is different from the others? Complete parts (a) through (e) below. E Click the icon to view the battery cost data. (a) Let u1. P2. H3 represent the mean prices for the group size 35, 65, and 24/24F respectively. Identify the claim and state Ho and H. H Cost of batteries by type The claim is the V hypothesis. Group size 35 Group size 65 Group size 24/24F 101 111 121 124 D 146 173 182 278 124 140 141 89 (b) Find the critical value, Fo, and identify the rejection region. 90 79 84 The rejection region is F Fo, where Fo = (Round to two decimal places as needed.) (c) Find the test statistic F. Print Done F= (Round to two decimal places as…arrow_forwardWhat are the values for SS and variance for the following sample of n = 3 scores? Sample: 8, 5, 2arrow_forward
- Nonearrow_forwardStatistics students believe that the mean score on a first statistics test is 65. The instructor thinks that the mean score is higher. She samples 10 statistics students and obtains the scores: Grades 73.5 88 63.9 85.5 62.7 65 83.2 61.9 88 62.7 Test grades are believed to be normally distributed.Use a significance level of 5%. State the alternative hypothesis: HA:HA: μ>65μ>65 μ<65μ<65 μ≠65μ≠65 State the mean of the sample: State the standard error of the sample means: State the test statistic: t=t= State the p-value: Decision: Fail to reject the null hypothesis. Reject the null hypothesis.arrow_forwardCalculate the variance of the following data assume sample data: YOU MUST USE TWO DECIMAL PLACES FOR THE MEAN THROUGHOUT YOUR CALCULATION Tigers Frequency 1 4 9 8 CO 13 8 CO 17 21 10 9 ANSWER INSTRUCTION: Round your answer to two decimal places then enter them in the answer box.arrow_forward
- Refer to the below table. Using an alpha = 0.05, test the claim that IQ scores are the same for children in three different blood lead level groups: low lead level, medium lead level, and high lead level). One-Way Analysis of Variance Summary Table for IQ Measurements for Children among Three Blood Lead Level Groups: Low Lead Level, Medium Lead Level, and High Lead Level. Source df SS MS F p Between-group (treatment) 2 469.1827 2677.864 2.30 0.104 Within-group (error) 118 203.6918 11745.05 Total 120arrow_forwardNeed help with missing boxesarrow_forward
arrow_back_ios
arrow_forward_ios
Recommended textbooks for you
- MATLAB: An Introduction with ApplicationsStatisticsISBN:9781119256830Author:Amos GilatPublisher:John Wiley & Sons Inc
 Probability and Statistics for Engineering and th...StatisticsISBN:9781305251809Author:Jay L. DevorePublisher:Cengage Learning
 Statistics for The Behavioral Sciences (MindTap C...StatisticsISBN:9781305504912Author:Frederick J Gravetter, Larry B. WallnauPublisher:Cengage Learning
  Elementary Statistics: Picturing the World (7th E...StatisticsISBN:9780134683416Author:Ron Larson, Betsy FarberPublisher:PEARSON
 The Basic Practice of StatisticsStatisticsISBN:9781319042578Author:David S. Moore, William I. Notz, Michael A. FlignerPublisher:W. H. Freeman
 Introduction to the Practice of StatisticsStatisticsISBN:9781319013387Author:David S. Moore, George P. McCabe, Bruce A. CraigPublisher:W. H. Freeman
MATLAB: An Introduction with Applications
Statistics
ISBN:9781119256830
Author:Amos Gilat
Publisher:John Wiley & Sons Inc
Probability and Statistics for Engineering and th...
Statistics
ISBN:9781305251809
Author:Jay L. Devore
Publisher:Cengage Learning
Statistics for The Behavioral Sciences (MindTap C...
Statistics
ISBN:9781305504912
Author:Frederick J Gravetter, Larry B. Wallnau
Publisher:Cengage Learning
Elementary Statistics: Picturing the World (7th E...
Statistics
ISBN:9780134683416
Author:Ron Larson, Betsy Farber
Publisher:PEARSON
The Basic Practice of Statistics
Statistics
ISBN:9781319042578
Author:David S. Moore, William I. Notz, Michael A. Fligner
Publisher:W. H. Freeman
Introduction to the Practice of Statistics
Statistics
ISBN:9781319013387
Author:David S. Moore, George P. McCabe, Bruce A. Craig
Publisher:W. H. Freeman