
MATLAB: An Introduction with Applications
6th Edition
ISBN: 9781119256830
Author: Amos Gilat
Publisher: John Wiley & Sons Inc
expand_more
expand_more
format_list_bulleted
Related questions
Question
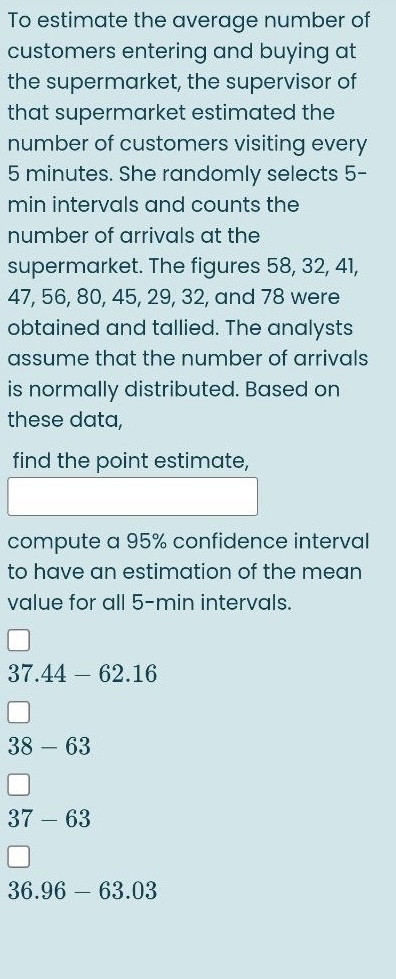

Transcribed Image Text:To estimate the average number of
customers entering and buying at
the supermarket, the supervisor of
that supermarket estimated the
number of customers visiting every
5 minutes. She randomly selects 5-
min intervals and counts the
number of arrivals at the
supermarket. The figures 58, 32, 41,
47, 56, 80, 45, 29, 32, and 78 were
obtained and tallied. The analysts
assume that the number of arrivals
is normally distributed. Based on
these data,
find the point estimate,
compute a 95% confidence interval
to have an estimation of the mean
value for all 5-min intervals.
37.44 62.16
38 – 63
37 – 63
36.96 – 63.03
Expert Solution
This question has been solved!
Explore an expertly crafted, step-by-step solution for a thorough understanding of key concepts.

Step by stepSolved in 2 steps with 1 images

Knowledge Booster

Similar questions
- A survey of 700 non fatal accidents showed that 287 involved defective equipment. Find a point estimate for p, the population proportion of accidents that involved defective equipment and round to 4 decimal places if needed.arrow_forwardA sports psychologist wants to compare the running time for athletes vs non-athletes while running 1 mile. He collects data from 226 non-athletes and 166 athletes and analyzes it using SPSS.arrow_forwardThe average fruit fly will lay 377 eggs into rotting fruit. A biologist wants to see if the average will be greater for flies that have a certain gene modified. The data below shows the number of eggs that were laid into rotting fruit by several fruit flies that had this gene modified. Assume that the distribution of the population is normal. 367, 374, 364, 388, 407, 369, 375, 362, 403, 383, 381, 391, 371 What can be concluded at the the αα = 0.10 level of significance level of significance? The test statistic = (please show your answer to 3 decimal places.) The p-value = (Please show your answer to 4 decimal places.)arrow_forward
- An automotive manufacturer wants to know the proportion of new car buyers who prefer foreign cars over domestic. Step 1 of 2 : Suppose a sample of 1217 new car buyers is drawn. Of those sampled, 267 preferred foreign over domestic cars. Using the data, estimate the proportion of new car buyers who prefer foreign cars. Enter your answer as a fraction or a decimal number rounded to three decimal places.arrow_forwardThere are 435 seats in a nation's House of Representatives. The number of representatives per state is calculated using a statistical formula determined by law, but allocation is roughly proportionate to population. In 2010, the nation's population was estimated to be 309.1 million. The state's population was estimated at 26.1 million. How many representatives would you expect to be assigned to the state? Suppose the state actually has 34 representatives. Compare this with the expected number of representatives from the state.arrow_forward
arrow_back_ios
arrow_forward_ios
Recommended textbooks for you
- MATLAB: An Introduction with ApplicationsStatisticsISBN:9781119256830Author:Amos GilatPublisher:John Wiley & Sons Inc
 Probability and Statistics for Engineering and th...StatisticsISBN:9781305251809Author:Jay L. DevorePublisher:Cengage Learning
 Statistics for The Behavioral Sciences (MindTap C...StatisticsISBN:9781305504912Author:Frederick J Gravetter, Larry B. WallnauPublisher:Cengage Learning
  Elementary Statistics: Picturing the World (7th E...StatisticsISBN:9780134683416Author:Ron Larson, Betsy FarberPublisher:PEARSON
 The Basic Practice of StatisticsStatisticsISBN:9781319042578Author:David S. Moore, William I. Notz, Michael A. FlignerPublisher:W. H. Freeman
 Introduction to the Practice of StatisticsStatisticsISBN:9781319013387Author:David S. Moore, George P. McCabe, Bruce A. CraigPublisher:W. H. Freeman
MATLAB: An Introduction with Applications
Statistics
ISBN:9781119256830
Author:Amos Gilat
Publisher:John Wiley & Sons Inc
Probability and Statistics for Engineering and th...
Statistics
ISBN:9781305251809
Author:Jay L. Devore
Publisher:Cengage Learning
Statistics for The Behavioral Sciences (MindTap C...
Statistics
ISBN:9781305504912
Author:Frederick J Gravetter, Larry B. Wallnau
Publisher:Cengage Learning
Elementary Statistics: Picturing the World (7th E...
Statistics
ISBN:9780134683416
Author:Ron Larson, Betsy Farber
Publisher:PEARSON
The Basic Practice of Statistics
Statistics
ISBN:9781319042578
Author:David S. Moore, William I. Notz, Michael A. Fligner
Publisher:W. H. Freeman
Introduction to the Practice of Statistics
Statistics
ISBN:9781319013387
Author:David S. Moore, George P. McCabe, Bruce A. Craig
Publisher:W. H. Freeman