MATLAB: An Introduction with Applications
6th Edition
ISBN: 9781119256830
Author: Amos Gilat
Publisher: John Wiley & Sons Inc
expand_more
expand_more
format_list_bulleted
Question
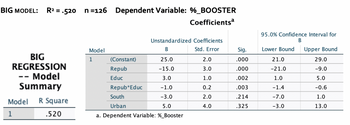
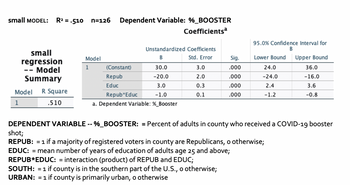
1.To determine which of the two models above – BIG or small – is statistically superior at the .05 level, please calculate the appropriate F-statistic (4 decimal places).
2. How many degrees of freedom are there?

Transcribed Image Text:BIG MODEL: R² = .520_n=126 Dependent Variable: %_BOOSTER
Coefficientsa
Unstandardized Coefficients
Std. Error
Model
B
1
(Constant)
25.0
2.0
Repub
-15.0
3.0
BIG
REGRESSION
-- Model
Summary
Educ
3.0
1.0
Repub*Educ
-1.0
0.2
South
-3.0
2.0
Model R Square
Urban
5.0
4.0
1
.520
a. Dependent Variable: %_Booster
Sig.
.000
.000
.002
.003
.214
.325
95.0% Confidence Interval for
B
Lower Bound
Upper Bound
21.0
29.0
-21.0
-9.0
1.0
5.0
-1.4
-0.6
-7.0
1.0
-3.0
13.0

Transcribed Image Text:small MODEL:
n=126 Dependent Variable: %_BOOSTER
Coefficientsa
95.0% Confidence Interval for
B
Unstandardized Coefficients
small
regression
Model
B
Std. Error
Sig.
Lower Bound Upper Bound
1
(Constant)
30.0
3.0
-- Model
.000
24.0
36.0
Repub
-20.0
2.0
Summary
.000
-24.0
-16.0
Educ
3.0
0.3
.000
2.4
3.6
Model R Square
Repub*Educ
-1.0
0.1
.000
-1.2
-0.8
1
.510
a. Dependent Variable: %_Booster
DEPENDENT VARIABLE -- %_BOOSTER: = Percent of adults in county who received a COVID-19 booster
shot;
REPUB: = 1 if a majority of registered voters in county are Republicans, o otherwise;
EDUC: = mean number of years of education of adults age 25 and above;
REPUB*EDUC: = interaction (product) of REPUB and EDUC;
SOUTH: = 1 if county is in the southern part of the U.S., o otherwise;
URBAN: = 1 if county is primarily urban, o otherwise
R² = .510
Expert Solution
This question has been solved!
Explore an expertly crafted, step-by-step solution for a thorough understanding of key concepts.
Step by stepSolved in 3 steps with 3 images

Knowledge Booster
Similar questions
- An experimental diet to induce weight loss was followed for one week by a randomly selected group of 12 students with the following results. Loss in Pounds Student 1 2 3 5 6 7 8 9 10 11 12 2.5 2.9 0.4 1.7 0.0 1.5 5.5 3.5 3.9 3.5 1.1 2.9 (a) Find a point estimate for the average amount lost after one week on this diet. 2.55 ]x Is this an unbiased estimate of the population mean? Explain. Yes, this an unbiased estimate of the population mean, since E(X) = µ. Yes, this an unbiased estimate of the population mean, since E(X) + μ. O No, this is not an unbiased estimate of the population mean, since E(X) * μ. O No, this is not an unbiased estimate of the population mean, since E(X) = μ. O No, this is not an unbiased estimate of the population mean, since the sample size is too small. (b) Find a point estimate for the variance of the amount lost on this diet. (Round your answer to four decimal places.) 2.3264 x Is this an unbiased estimate of the population variance? Explain. Yes, this an…arrow_forwardA taxi cab company takes a random sample of 50 of its taxis and notes their miles per gallon (mpg) on a test run. The computer output is shown below. Mean St Dev Min Q1 Q2 Q3 Max 19.78 3.09 13.30 17.80 20.00 21.83 26.00 50% of the taxis have MPG lower than what value? Group of answer choices A. 20 MPG B. (21.83 - 17.80) MPG C. 19.78 MPG D. (26-13.30)/2 MPGarrow_forwardA violin student records the number of hours they spend practicing during each of ten consecutive weeks. 2.5 3.5 3 2.4 What is the first quartile for this data? 3.6 7 8.1 5.4 7 4.1 8.6arrow_forward
- 1.A chi-square test for independence is being used to evaluate the relationship between two variables, one of which is classified into 3 categories and the second of which is classified into 4 categories. What is the df value for the chi-square statistic? Group of answer choices A.6 B.11 C.4 D.10arrow_forward2. Recovering from surgery: A new postsurgical treatment was compared with a stan- dard treatment. Seven subjects received the new treatment, while seven others (the controls) received the standard treatment. The recovery times, in days, are given below. Can you conclude that the mean recovery time for those receiving the new treatment is less than the mean for those receiving the standard treatment? Use the a = 0.05 level. Treatment: Control: H₁: 12 18 (a) List the null and alternate hypetheses. Ho : (c) List the P-value. 13 23 (d) Make the comparison. 15 24 19 30 20 32 (b) List the distribution, the test statistic, the calculator program, and all input and output variables. 21 35 We reject Ho / We do not reject Ho (circle one) (e) State the final conclusion in the wording of the problem. 24 39arrow_forwardIn the data set below, what is the upper quartile? 6 6 6 6 7 7 8 8 9 9 9 Submitarrow_forward
arrow_back_ios
arrow_forward_ios
Recommended textbooks for you
 MATLAB: An Introduction with ApplicationsStatisticsISBN:9781119256830Author:Amos GilatPublisher:John Wiley & Sons Inc
 Probability and Statistics for Engineering and th...StatisticsISBN:9781305251809Author:Jay L. DevorePublisher:Cengage Learning
 Statistics for The Behavioral Sciences (MindTap C...StatisticsISBN:9781305504912Author:Frederick J Gravetter, Larry B. WallnauPublisher:Cengage Learning
 Elementary Statistics: Picturing the World (7th E...StatisticsISBN:9780134683416Author:Ron Larson, Betsy FarberPublisher:PEARSON
 The Basic Practice of StatisticsStatisticsISBN:9781319042578Author:David S. Moore, William I. Notz, Michael A. FlignerPublisher:W. H. Freeman
 Introduction to the Practice of StatisticsStatisticsISBN:9781319013387Author:David S. Moore, George P. McCabe, Bruce A. CraigPublisher:W. H. Freeman

MATLAB: An Introduction with Applications
Statistics
ISBN:9781119256830
Author:Amos Gilat
Publisher:John Wiley & Sons Inc

Probability and Statistics for Engineering and th...
Statistics
ISBN:9781305251809
Author:Jay L. Devore
Publisher:Cengage Learning

Statistics for The Behavioral Sciences (MindTap C...
Statistics
ISBN:9781305504912
Author:Frederick J Gravetter, Larry B. Wallnau
Publisher:Cengage Learning

Elementary Statistics: Picturing the World (7th E...
Statistics
ISBN:9780134683416
Author:Ron Larson, Betsy Farber
Publisher:PEARSON

The Basic Practice of Statistics
Statistics
ISBN:9781319042578
Author:David S. Moore, William I. Notz, Michael A. Fligner
Publisher:W. H. Freeman

Introduction to the Practice of Statistics
Statistics
ISBN:9781319013387
Author:David S. Moore, George P. McCabe, Bruce A. Craig
Publisher:W. H. Freeman