
MATLAB: An Introduction with Applications
6th Edition
ISBN: 9781119256830
Author: Amos Gilat
Publisher: John Wiley & Sons Inc
expand_more
expand_more
format_list_bulleted
Related questions
Question
What is the test statistic and the p value?
It is a two tailed test
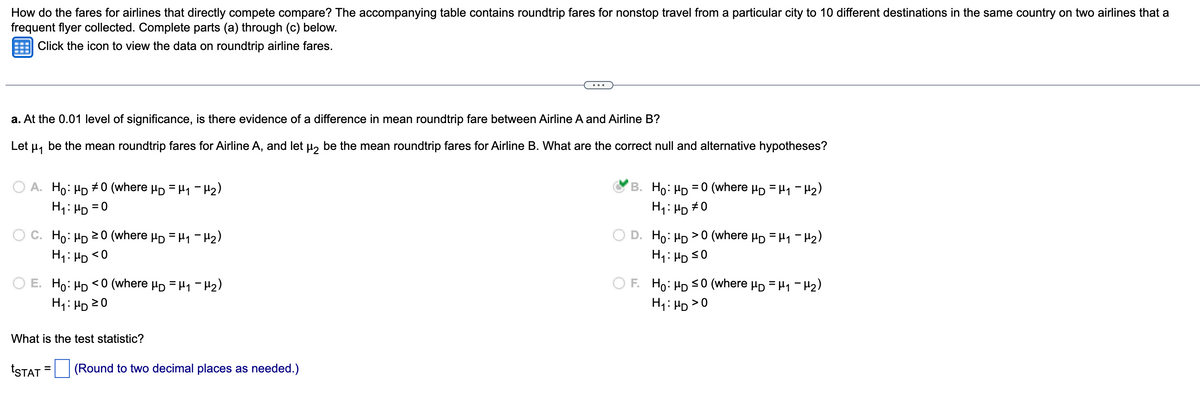

Transcribed Image Text:How do the fares for airlines that directly compete compare? The accompanying table contains roundtrip fares for nonstop travel from a particular city to 10 different destinations in the same country on two airlines that a
frequent flyer collected. Complete parts (a) through (c) below.
Click the icon to view the data on roundtrip airline fares.
a. At the 0.01 level of significance, is there evidence of a difference in mean roundtrip fare between Airline A and Airline B?
Let μ₁ be the mean roundtrip fares for Airline A, and let μ2 be the mean roundtrip fares for Airline B. What are the correct null and alternative hypotheses?
A. Ho: HD #0 (where μD = μ₁ −μ₂)
B. Ho: HD 0 (where μ = μ₁ −μ₂)
H₁: HD 0
H₁: HD = 0
C. Ho: HD 20 (where μD = μ₁ −μ₂)
Ho: HD > 0 (where μD = μ₁ −μ₂)
H₁: HD ≤0
H₁: HD <0
E. Ho: HD
<0 (where μD = μ₁ −μ₂)
F. Ho: HD ≤0 (where μ = μ₁ −μ₂)
H₁: HD > 0
H₁: HD 20
What is the test statistic?
=
*STAT
(Round to two decimal places as needed.)

Transcribed Image Text:Airfares
Airline A Fare ($)
740
705
978
1150
641
999
967
720
1107
1189
Airline B Fare ($)
743
708
981
1153
644
1002
970
723
1138
1192
I
X
Expert Solution
This question has been solved!
Explore an expertly crafted, step-by-step solution for a thorough understanding of key concepts.

Step by stepSolved in 3 steps with 1 images

Knowledge Booster

Similar questions
- How does changing from two-tailed test to one-tailed test increases power of a statistical test?arrow_forwardIf an ANOVA test is conducted and the null hypothesis is rejected, what does this indicate? Multiple Choice The p-value is greater than a. At least one pair of population means is different. The population means are equal. All population means are different.arrow_forwardTest the claim that the proportion of men who own cats is significantly different than the proportion of women who own cats at the 0.01 significance level. Based on a sample of 80 men, 25% owned catsBased on a sample of 40 women, 50% owned catsThe test statistic is: (to 2 decimals)The p-value is: (to 2 decimals)arrow_forward
- LICENSE x ED COURSE, PART 4 of 4. What is your statistical decision? The following 2 X 2 chart represents whether high school students passed the road test for their driver’s license on the first attempt by whether they took a driver’s education course. What is your statistical decision?arrow_forwardTest the claim that the proportion of people who own cats is larger than 40% at the 0.1 significance level. Based on a sample of 500 people, 46% owned catsThe test statistic is: (to 2 decimals)The p-value is: (to 2 decimals)arrow_forwardWhat is p? What happens to type 1 and type 2 error when you raise and lower your p-value?arrow_forward
- Example: 63 32 29 Q1: What is the value of your test statistic? Q2: What is the critical value from the F table? Q3: Doing a hypothesis test, is variance B greater than variance A? English (United States) C3 Focus 82arrow_forwardcan you find two tailed test p value for given data sample size 14 test statistics -2.23arrow_forwardTest: The mean age of judges in Los Angeles is 48.6 years. Identify the null hypothesis and alternative hypothesis.arrow_forward
arrow_back_ios
SEE MORE QUESTIONS
arrow_forward_ios
Recommended textbooks for you
- MATLAB: An Introduction with ApplicationsStatisticsISBN:9781119256830Author:Amos GilatPublisher:John Wiley & Sons Inc
 Probability and Statistics for Engineering and th...StatisticsISBN:9781305251809Author:Jay L. DevorePublisher:Cengage Learning
 Statistics for The Behavioral Sciences (MindTap C...StatisticsISBN:9781305504912Author:Frederick J Gravetter, Larry B. WallnauPublisher:Cengage Learning
  Elementary Statistics: Picturing the World (7th E...StatisticsISBN:9780134683416Author:Ron Larson, Betsy FarberPublisher:PEARSON
 The Basic Practice of StatisticsStatisticsISBN:9781319042578Author:David S. Moore, William I. Notz, Michael A. FlignerPublisher:W. H. Freeman
 Introduction to the Practice of StatisticsStatisticsISBN:9781319013387Author:David S. Moore, George P. McCabe, Bruce A. CraigPublisher:W. H. Freeman
MATLAB: An Introduction with Applications
Statistics
ISBN:9781119256830
Author:Amos Gilat
Publisher:John Wiley & Sons Inc
Probability and Statistics for Engineering and th...
Statistics
ISBN:9781305251809
Author:Jay L. Devore
Publisher:Cengage Learning
Statistics for The Behavioral Sciences (MindTap C...
Statistics
ISBN:9781305504912
Author:Frederick J Gravetter, Larry B. Wallnau
Publisher:Cengage Learning
Elementary Statistics: Picturing the World (7th E...
Statistics
ISBN:9780134683416
Author:Ron Larson, Betsy Farber
Publisher:PEARSON
The Basic Practice of Statistics
Statistics
ISBN:9781319042578
Author:David S. Moore, William I. Notz, Michael A. Fligner
Publisher:W. H. Freeman
Introduction to the Practice of Statistics
Statistics
ISBN:9781319013387
Author:David S. Moore, George P. McCabe, Bruce A. Craig
Publisher:W. H. Freeman