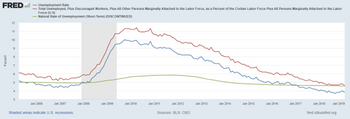
This is a graph of 3 measures of
The Blue line is the unemployment rate as measured by the BLS
The Green line is the Natural rate of unemployment, the target rate, the NAIRU.
The gray bar represents the recession of 2008, and the subsequent recovery of the economy afterwards. This was evidenced by a gradual increase in

Trending nowThis is a popular solution!
Step by stepSolved in 4 steps

- Describe a situation, either a government policy situation, an economic problem, or a private sector situation, where using the GDP deflator to convert from nominal to real would be more appropriate than using the CPI.arrow_forwardA country with a population of eight million adults has five million employed, 500,000 unemployed, and the rest 0f the adult population is out of the labor force. Whats the unemployment rate? What share of population is in the labor force? Sketch a pie chart that divides the adult population into these three groups.arrow_forwardDo you think perfect indexing is possible? Why or why not?arrow_forward
- If inflation rises unexpectedly by 5, indicate for each of the following whether the economic actor is helped, hurt, or unaffected: A union member with a COLA wage contract Someone with a large stash of cash in a safe deposit box A bank lending money at a fixed rate of interest A person who is not due to receive a pay raise for another 11 monthsarrow_forwardNominal GDP in Nowhereland in 2018 and 2019 is as follows: Can you say that the production of goods and services in Nowhereland has increased between 2018 and 2019? Why or why not?arrow_forwardConstruct the price index for a fruit basket in each year using 2003 as the base year.arrow_forward
- What are the two biggest recessions in terms of length and magnitude in the Graph. Remember shahded areas show recession and 2020 is not a part of the graph. How does the unemployment rate react during the two main recessions you have identified? Please answer both questions.arrow_forwardPlease help solvearrow_forward9:09 PM Mon Nov 21 < tab shift (8) Ch 10 Assignment i 2 10 points eBook Print caps lock Students HS Students Ho... References q .?123 a AA Problem 10-02 (algo) % N Suppose the following data describe a nation's population: Z Population Labor force Unemployed 0₂ Year 2: b. Between Year 1 and Year 2, Instructions: Round your responses to two decimal places. a. What is the unemployment rate in each year? Year 1: {N W #S ii. the unemployment rate S X 1% i. the number of unemployed persons [did not change 3 CD C ezto.mheducation.com s Students Ho... e Year 1 25 million 14 million 0.5 million GA O d C 4 r & -20 Saved f 50+ decreased t Year 2 26 million 14.5 million 0.5 million * Fundamenta... CO g 6 y h 1 11 1 V b n 7 u Help X 10 Assignme... ents Ho... 3 8 i j k Save & Exit ! SO I Check my work ? + .?123 Submit 0 р 42% delete return shiftarrow_forward
- Suppose 25,000 persons become unemployed. You are given the following data about the length of unemployment spells in the economy:Duration of Spell (in months) Exit Rate1 0.602 0.203 0.204 0.205 0.206 1.00where the exit rate for month t gives the fraction of unemployed persons who have been unemployed t months and who “escape” unemployment at the end of the month.a. How many unemployment-months will the 25,000 unemployed workers experience?b. What fraction of persons who are unemployed are “long-term unemployed” in that their unemployment spells will last five or more months?c. What fraction of unemployment months can be attributed…arrow_forwardEllen is downloading labor market data for the most recent month, but her connection isslow. So far thisß is all she has been able to collect:Unemployment rate 5.2%Participation rate 62.5%Not in the labor force 60 millionFind the● working-age population● the labor force● the number of employed workers● The number of unemployed workers.arrow_forwardPlease hep with this question ? That is attatched show how calcualtion was made thank you,arrow_forward
 Principles of Economics 2eEconomicsISBN:9781947172364Author:Steven A. Greenlaw; David ShapiroPublisher:OpenStax
 Macroeconomics: Private and Public Choice (MindTa...EconomicsISBN:9781305506756Author:James D. Gwartney, Richard L. Stroup, Russell S. Sobel, David A. MacphersonPublisher:Cengage Learning
 Economics: Private and Public Choice (MindTap Cou...EconomicsISBN:9781305506725Author:James D. Gwartney, Richard L. Stroup, Russell S. Sobel, David A. MacphersonPublisher:Cengage Learning
 Essentials of Economics (MindTap Course List)EconomicsISBN:9781337091992Author:N. Gregory MankiwPublisher:Cengage Learning
 Principles of Economics (MindTap Course List)EconomicsISBN:9781305585126Author:N. Gregory MankiwPublisher:Cengage Learning
 Principles of Macroeconomics (MindTap Course List)EconomicsISBN:9781285165912Author:N. Gregory MankiwPublisher:Cengage Learning


