ENGR.ECONOMIC ANALYSIS
14th Edition
ISBN: 9780190931919
Author: NEWNAN
Publisher: Oxford University Press
expand_more
expand_more
format_list_bulleted
Question

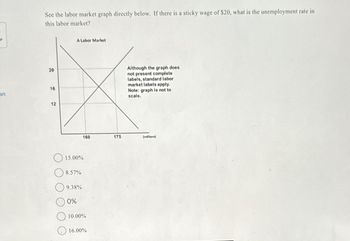
Transcribed Image Text:See the labor market graph directly below. If there is a sticky wage of $20, what is the unemployment rate in
this labor market?
20
on
16
16
12
A Labor Market
160
15.00%
8.57%
9.38%
>0%
10.00%
16.00%
Although the graph does
not present complete
labels, standard labor
market labels apply.
Note: graph is not to
scale.
175
(millions)
Expert Solution
This question has been solved!
Explore an expertly crafted, step-by-step solution for a thorough understanding of key concepts.
This is a popular solution
Trending nowThis is a popular solution!
Step by stepSolved in 3 steps with 3 images

Knowledge Booster
Learn more about
Need a deep-dive on the concept behind this application? Look no further. Learn more about this topic, economics and related others by exploring similar questions and additional content below.Similar questions
- Real Wage Number of Workers Demanded Labor Force Participation Rate 60 120,000,000 30% 70 110,000,000 35% 80 100,000,000 40% 90 90,000,000 45% 100 80,000,000 50% 110 70,000,000 55% 120 60,000,000 60% 130 50,000,000 65% 140 40,000,000 70% 150 30,000,000 75% 160 20,000,000 80% 170 10,000,000 85% Ignore what happened in the previous question. The table above shows some pieces of information about the labor market condition in a country. It shows the number of workers demanded in the country at different levels of real wage. It also shows the labor force participation rates at those real wage levels. For example, if the real wage is 60, only 30% of the civilian population will participate in the labor force. If the real wage is 170, some 85% will participate in the labor force. The general price level in this country is P = 100. The civilian population in this country is 100 million persons. Assume that wages and prices are fully flexible upwards and…arrow_forwardMonth CPI January 281.93 February 284.18 March 287.71 April 288.66 The minimum wage was $1.60 in 1968. The CPI in December of 1968 was 35.6 and we have the data above for CPI values in 2022. What is the value of the 1968 minimum wage in April 2022 terms? Round your answer to two digits after the decimal without the dollar sign. Make sure you are using the correct base period.arrow_forwardgive me correct and accurate answer with calculation otherwise i give downvote Note:- Please avoid using ChatGPT and refrain from providing handwritten solutions; otherwise, I will definitely give a downvote. Also, be mindful of plagiarism. Answer completely and accurate answer. Rest assured, you will receive an upvote if the answer is accurate.arrow_forward
- Question 3 The table below gives some labor statistics (from the Bureau of Labor Statistics) for years 1995, 2000 and 2005. Use these data to answer the following questions. Express your answers in percentage terms to two places past the decimal. Variable 1995 2000 2005 Population 26,000,000 27,000,000 28,000,000 Adult population 18,000,000 19,000,000 20,500,000 Adult population able to work 17,900,000 18,800,000 20,000,000 Adult population able and wanting to work 15,700,000 16,500,000 18,000,000 Number employed 14,000,000 14,500,000 15,000,000 Number unemployed 1,000,000 1,500,000 2,500,000 a. Define labor force. For each year find the labor force b. Define the labor-force participation rate. Calculate it for each year c. Calculate the unemployment rate for each year.arrow_forwardThis question requires effective research to gather pertinent labor market statistics. Consider the source of your data. Official labor market statistics are gathered into “jobs reports” by the United States federal governmental agency: the Bureau of Labor Statistics or BLS. (6 points.)a. Find the following statistics on employment in January, 2022:Unemployment rate: Labor Force Participation Rate: Employed population: c. Find the changes in each statistics from January, 2021 to January, 2022:Unemployment rate: Labor Force Participation Rate: Employed population: d. Find the changes in each statistics from January, 2010 to January, 2011:Unemployment rate: Labor Force Participation Rate: Employed population: e. Briefly compare the severity of the two recoveries citing relevant statistics.arrow_forwardThe following table contains unemployment statistics from 2013 for three different countries: Australia, the Netherlands, and France. (Source: “International Labor Comparisons.”Bureau of Labor Statistics) Fill in the table using the given data. Country Working-Age (Civilian Not in Civilian Employed Unemployed Unemployment Non-institutionalized) the Labor Force Labor Force (Thousands) (Thousands) Rate Population (Thousands) (Thousands) (Percent) (Thousands) Australia 18,332 6,196 12,136 11,501 635 Netherlands 13,629 4,796 8,364 469 France 22,411 25,547 2,824arrow_forward
arrow_back_ios
arrow_forward_ios
Recommended textbooks for you

 Principles of Economics (12th Edition)EconomicsISBN:9780134078779Author:Karl E. Case, Ray C. Fair, Sharon E. OsterPublisher:PEARSON
 Engineering Economy (17th Edition)EconomicsISBN:9780134870069Author:William G. Sullivan, Elin M. Wicks, C. Patrick KoellingPublisher:PEARSON
 Principles of Economics (MindTap Course List)EconomicsISBN:9781305585126Author:N. Gregory MankiwPublisher:Cengage Learning
 Managerial Economics: A Problem Solving ApproachEconomicsISBN:9781337106665Author:Luke M. Froeb, Brian T. McCann, Michael R. Ward, Mike ShorPublisher:Cengage Learning
 Managerial Economics & Business Strategy (Mcgraw-...EconomicsISBN:9781259290619Author:Michael Baye, Jeff PrincePublisher:McGraw-Hill Education


Principles of Economics (12th Edition)
Economics
ISBN:9780134078779
Author:Karl E. Case, Ray C. Fair, Sharon E. Oster
Publisher:PEARSON

Engineering Economy (17th Edition)
Economics
ISBN:9780134870069
Author:William G. Sullivan, Elin M. Wicks, C. Patrick Koelling
Publisher:PEARSON

Principles of Economics (MindTap Course List)
Economics
ISBN:9781305585126
Author:N. Gregory Mankiw
Publisher:Cengage Learning

Managerial Economics: A Problem Solving Approach
Economics
ISBN:9781337106665
Author:Luke M. Froeb, Brian T. McCann, Michael R. Ward, Mike Shor
Publisher:Cengage Learning

Managerial Economics & Business Strategy (Mcgraw-...
Economics
ISBN:9781259290619
Author:Michael Baye, Jeff Prince
Publisher:McGraw-Hill Education