
Essentials Of Investments
11th Edition
ISBN: 9781260013924
Author: Bodie, Zvi, Kane, Alex, MARCUS, Alan J.
Publisher: Mcgraw-hill Education,
expand_more
expand_more
format_list_bulleted
Related questions
Question
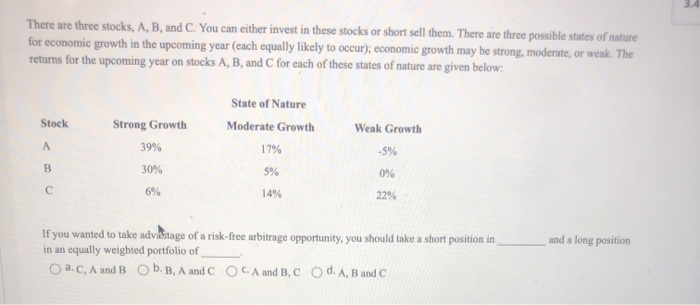

Transcribed Image Text:There are three stocks, A, B, and C. You can either invest in these stocks or short sell them. There are three possible states of nature
for economic growth in the upcoming year (each equally likely to occur); economic growth may be strong, moderate, or weak. The
returns for the upcoming year on stocks A, B, and C for each of these states of nature are given below:
Stock
A
B
с
Strong Growth
39%
30%
6%
State of Nature
Moderate Growth
17%
5%
14%
Weak Growth
-5%
0%
22%
If you wanted to take advantage of a risk-free arbitrage opportunity, you should take a short position in
in an equally weighted portfolio of
O a. C, A and B O b. B, A and C OCA and B, C O d. A, B and C
and a long position
F
Expert Solution
This question has been solved!
Explore an expertly crafted, step-by-step solution for a thorough understanding of key concepts.

This is a popular solution

Trending nowThis is a popular solution!

Step by stepSolved in 3 steps

Knowledge Booster

Similar questions
- A stock analyst at JP Dealers believes that a stock will earn the following returns next period depending on the state of the economy. Given the information below, what is the expected return on the stock? State of Economy Probability Return if State Occurs Depression 30% -10% Normal 50% 11% Boom 20% 18% Enter answer in decimal form, rounded to 4th digit, as in "0.1234"arrow_forwardHistorical Realized Rates of Return You are considering an investment in either individual stocks or a portfolio of stocks. The two stocks you are researching, Stock A and Stock B, have the following historical returns: ΤΑ -17.00% 37.00 28.00 ЇВ -6.00% 16.00 -12.00 -5.00 47.00 23.00 21.00 a. Calculate the average rate of return for each stock during the 5-year period. Do not round intermediate calculations. Round your answers to two decimal places. Stock A: Stock B: % % Std. Dev. b. Suppose you had held a portfolio consisting of 50% of Stock A and 50% of Stock B. What would have been the realized rate of return on the portfolio in each year? What would have been the average return on the portfolio during this period? Do not round intermediate calculations. Round your answers to two decimal places. Negative values, if any, should be indicated by a minus sign. Year 2017 2018 2019 2020 2021 Average return c. Calculate the standard deviation of returns for each stock and for the portfolio.…arrow_forward19. You have developed data which give (1) the percentage annual returns of the market for the past five years and (2) similar percentage annual returns information on Stocks A and B. Which of the possible answers best describes the historical beta for A and B? Years Market % returns Stock A % returns Stock B % returns 2023 3% 16% 5% 2022 5% 20% 5% 2021 1% 10% 5% 2020 -10% -25% 5% 2019 6% 24% 5% A) bA > 0; bB = 1. B) bA > +1; bB = 0. C) bA = 0; bB < ─1. D) bA < +1; bB = 0. E) bA > ─1; bB > 1. F) None of the above (state your answer)arrow_forward
- (Computing rates of return) From the following price data, compute the annual rates of return for Asman and Salinas. Time 1 2 3 12 4 14 (Click on the icon in order to copy its contents into a spreadsheet.) How would you interpret the meaning of the annual rates of return? Asman $9 11 Salinas $30 27 32 36 The rate of return you would have earned on Asman stock from time 1 to time 2 is %. (Round to two decimal places.)arrow_forwardAn analyst gathered the following information for a stock and market parameters: stock beta= 1.08; • expected return on the Market = 11.97%; • expected return on T-bills = 1.55%; • current stock Price = $9.01; • expected stock price in one year = $11.14; • expected dividend payment next year = $3.23. Calculate the expected return for this stock. Please share your answer as a percentage rounded to 2 decimal places.arrow_forwardUse the table for the question(s) below. Consider the following realized annual returns: Index Stock A Year End Realized. Realized Return Return 23.6% 46.3% 24.7% 26.7% 30.5% 86.9% 9.0% 23.1% -2.0% 0.2% -17.3% -3.2% -24.3% -27.0% 32.2% 27.9% 4.4% -5.1% 7.4% -11.3% 2000 2001 2002 2003 2004 2005 2006 2007 2008 2009 Suppose that you want to use the 10-year historical average return on Stock A to forecast the expected future return on Stock A. The 95% confidence interval for your estimate of the expect return is closest to: O 6.5% to 26.3%. O-15.0% to 47.9%. -4.5% to 37.4%. 13.2% to 19.5%.arrow_forward
- Problem 3:Here are the annual returns for five different stocks. Determine the expected return and risk for a period of five years for each of the stocks. Problem 4:a. Find the coefficient of variation (CV) for each of the actions in problem 3.b. Explain which of the investments a risk averse investor would prefer and which a risk lover investor would prefer. Answer clearly and in detail. Show all the computations that led to the result.arrow_forwardYou are given the following returns on "the market" and Stock F during the last three years. We could calculate beta using data for Years 1 and 2 and then, after Year 3, calculate a new beta for Years 2 and 3. How different are those two betas, i.e., what's the value of beta 2 - beta 1? (Hint: You can find betas using the Rise-Over-Run method, or using your calculator's regression function.) Year Market Stock F 1 6.10% 19.50% 2 12.90% −3.70% 3 16.20% 21.71% A. 10.96 B. 10.91 C. 11.06 D. 11.01 E. 11.11 Note:- Do not provide handwritten solution. Maintain accuracy and quality in your answer. Take care of plagiarism. Answer completely. You will get up vote for sure.arrow_forwardIf you look at stock prices over any year, you will find a high and low stock price for the year. Instead of a single benchmark PE ratio, we have a high and low PE ratio for each year. We can use these ratios to calculate a high and a low stock price for the next year. Suppose we have the following information on a particular company: High price Low price EPS Year 1 $ 62.18 40.30 2.35 a. High target price b. Low target price Year 2 $ 67.29 43.18 2.58 Year 3 $74.18 39.27 2.73 Year 4 $ 78.27 46.21 2.89 Earnings are expected to grow at 9 percent over the next year. a. What is the high target stock price in one year? Note: Do not round Intermediate calculations and round your answer to 2 decimal places, e.g., 32.16. b. What is the low target stock price in one year? Note: Do not round Intermediate calculations and round your answer to 2 decimal places, e.g., 32.16.arrow_forward
- (Common stock valuation) The common stock of NCP paid $1.35 in dividends last year. Dividends are expected to grow at an annual rate of 9.50 percent for an indefinite number of years. a. If your required rate of return is 11.60 percent, what is the value of the stock for you? b. Should you make the investment? a. If your required rate of return is 11.60 percent, the value of the stock for you is $ (Round to the nearest cent.)arrow_forwardIf you look at stock prices over any year, you will find a high and low stock price for the year. Instead of a single benchmark PE ratio, we now have a high and low PE ratio for each year. We can use these ratios to calculate a high and a low stock price for the next year. Suppose we have the following information on a particular company: High price Low price EPS Year 1 $ 85.61 68.33 6.46 a. High target price b. Low target price Year 2 $94.99 79.75 8.88 Year 3 $ 116.05 84.23 8.54 Year 4 $ 128.08 105.86 10.13 Earnings are expected to grow at 5.5 percent over the next year. a. What is the high target stock price over the next year? Note: Do not round intermediate calculations and round your answer to 2 decimal places, e.g., 32.16. b. What is the low target stock price over the next year? Note: Do not round intermediate calculations and round your answer to 2 decimal places, e.g., 32.16.arrow_forwardRead the information for 3 stocks X, Y and Z below. Rate of return when state occurs (For Stock X, Y, and Z) State of Economy Probability of State Stock X Stock Y Stock Z Boom 0.3 0.4 0.45 0.6 Normal 0.5 0.2 0.15 0.08 Recession 0.2 0 -0.3 -0.4 If your portfolio includes 35 percent of X, 40 percent of Y and 25 percent of Z, answerthe following questions: (a) Calculate the portfolio expected return.(b) Calculate the variance and the standard deviation of the portfolio (c) If the expected T-bill rate is 3.80 percent, calculate the expected risk premiumon the portfolio.arrow_forward
arrow_back_ios
SEE MORE QUESTIONS
arrow_forward_ios
Recommended textbooks for you
- Essentials Of InvestmentsFinanceISBN:9781260013924Author:Bodie, Zvi, Kane, Alex, MARCUS, Alan J.Publisher:Mcgraw-hill Education,


 Foundations Of FinanceFinanceISBN:9780134897264Author:KEOWN, Arthur J., Martin, John D., PETTY, J. WilliamPublisher:Pearson,
 Fundamentals of Financial Management (MindTap Cou...FinanceISBN:9781337395250Author:Eugene F. Brigham, Joel F. HoustonPublisher:Cengage Learning
 Corporate Finance (The Mcgraw-hill/Irwin Series i...FinanceISBN:9780077861759Author:Stephen A. Ross Franco Modigliani Professor of Financial Economics Professor, Randolph W Westerfield Robert R. Dockson Deans Chair in Bus. Admin., Jeffrey Jaffe, Bradford D Jordan ProfessorPublisher:McGraw-Hill Education
Essentials Of Investments
Finance
ISBN:9781260013924
Author:Bodie, Zvi, Kane, Alex, MARCUS, Alan J.
Publisher:Mcgraw-hill Education,
Foundations Of Finance
Finance
ISBN:9780134897264
Author:KEOWN, Arthur J., Martin, John D., PETTY, J. William
Publisher:Pearson,
Fundamentals of Financial Management (MindTap Cou...
Finance
ISBN:9781337395250
Author:Eugene F. Brigham, Joel F. Houston
Publisher:Cengage Learning
Corporate Finance (The Mcgraw-hill/Irwin Series i...
Finance
ISBN:9780077861759
Author:Stephen A. Ross Franco Modigliani Professor of Financial Economics Professor, Randolph W Westerfield Robert R. Dockson Deans Chair in Bus. Admin., Jeffrey Jaffe, Bradford D Jordan Professor
Publisher:McGraw-Hill Education