
MATLAB: An Introduction with Applications
6th Edition
ISBN: 9781119256830
Author: Amos Gilat
Publisher: John Wiley & Sons Inc
expand_more
expand_more
format_list_bulleted
Related questions
Concept explainers
Question
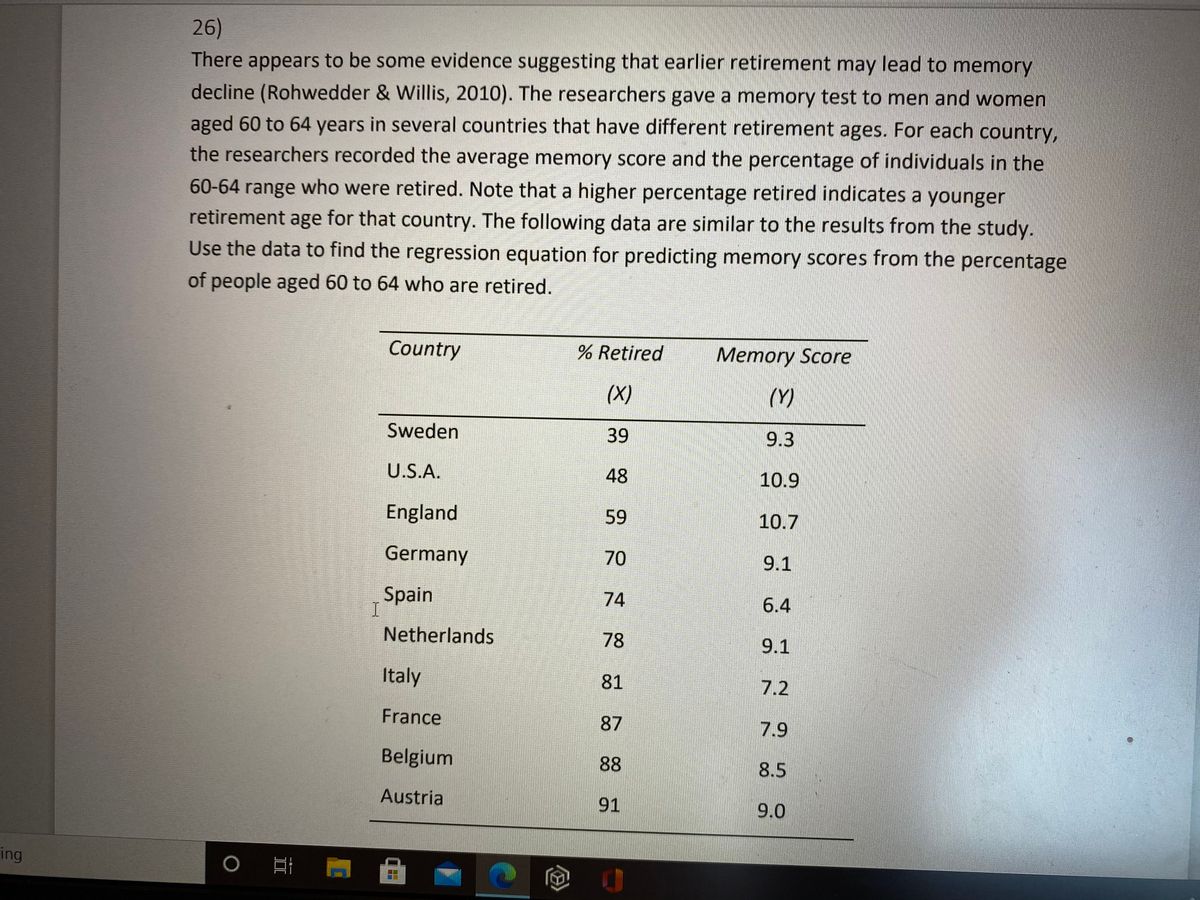

Transcribed Image Text:26)
There appears to be some evidence suggesting that earlier retirement may lead to memory
decline (Rohwedder & Willis, 2010). The researchers gave a memory test to men and women
aged 60 to 64 years in several countries that have different retirement ages. For each country,
the researchers recorded the average memory score and the percentage of individuals in the
60-64 range who were retired. Note that a higher percentage retired indicates a younger
retirement age for that country. The following data are similar to the results from the study.
Use the data to find the regression equation for predicting memory scores from the percentage
of people aged 60 to 64 who are retired.
Country
% Retired
Memory Score
(X)
(Y)
Sweden
39
9.3
U.S.A.
48
10.9
England
59
10.7
Germany
70
9.1
Spain
74
6.4
Netherlands
78
9.1
Italy
81
7.2
France
87
7.9
Belgium
88
8.5
Austria
91
9.0
ing
Expert Solution
This question has been solved!
Explore an expertly crafted, step-by-step solution for a thorough understanding of key concepts.

This is a popular solution

Trending nowThis is a popular solution!

Step by stepSolved in 2 steps with 3 images

Knowledge Booster


Learn more about
Need a deep-dive on the concept behind this application? Look no further. Learn more about this topic, statistics and related others by exploring similar questions and additional content below.Similar questions
- I need guidance on the last question listed at the end of this .... An experiment was conducted to determine if motivational techniques in management significantly affected employee stress levels compared to no intervention. An employee survey was given to three groups: one group under a manager who started using a transformational motivation technique, one group under a manager who began using a transactional motivation technique, and then a control group with no new technique used. Stress levels were self-reported by the employees on 10-point Likert scales (0 – no stress, 1- little stress, 9 – very high stress). The results are shown below. Use alpha = 0.05. Transformational Transactional Control 0 2 6 7 5 5 3 3 8 5 0 9 2 1 5 Null hypothesis: There is no significant difference in stress levels between the three groups. Alternative hypothesis: There is significance difference in stress levels between the three groups. The…arrow_forwardIn a survey of families in which both parents work, one of the questions asked was, “Have you refused a job, promotion, or transfer because it would mean less time with your family?” A total of 200 men and 200 women were asked this question. “Yes” was the response given by 29% of the men and 24% of the women. Based on this survey, can we conclude that there is a difference in the proportion of men and women responding “yes” at the 0.05 level of significance?arrow_forwardTim is interested in studying whether Cognitive Behavioural Therapy (CBT) is an effective treatment for Obsessive Compulsive Disorder (OCD). Six people who were diagnosed with OCD participated in Tim's study, where he recorded the number of times they washed their hands per day for one month. They were then given a three week intensive CBT program before their hand-washing was monitored for another month. The average number of times per day each participant washed their hands over the two months of observation are as follows: Participant Month 1 Month 2 1 11 6 2 8 5 3 14 17 4 10 10 5 22 11 6 15 10 Compute the appropriate statistic to determine whether the program was effective and use this information to fill in the blanks: Q1. revealed that the number of times per day participants washed their hands following the CBT program was Q2. compared to the number of times per day participants washed their hands before the…arrow_forward
- The following table is from a publication. The individuals in the following table have an eye irritation, a nose irritation, or a throat irritation. They have only one of the three. Is there sufficient evidence to reject the hypothesis that the type of ear, nose, or throat irritation is independent of the age group at a level of significance equal to 0.05? Age (years) Type of Irritation 18-29 30-44 45-64 65 and Older Eye 422 560 340 54 Nose 932 1324 802 101 Throat 247 309 142 24 (a) Find the test statistic. (Round your answer to two decimal places.)(ii) Find the p-value. (Round your answer to four decimal places.)(b) State the appropriate conclusion. Reject the null hypothesis. There is not significant evidence that this sample contradicts the claim of independence.Reject the null hypothesis. There is significant evidence that this sample contradicts the claim of independence. Fail to reject the null hypothesis. There is not significant…arrow_forwardThe following is based on information from The Wolf in the Southwest: The Making of an Endangered Species, by David E. Brown (University of Arizona Press). Before 1918, the proportion of female wolves in the general population of all southwestern wolves was about 50%. However, after 1918, southwestern cattle ranchers began a widespread effort to destroy wolves. In a recent sample of 37 wolves, there were only 11 females. One theory is that male wolves tend to return sooner than females to their old territories, where their predecessors were exterminated. Do these data indicate that the population proportion of female wolves is now less than 50% in the region? Use α = 0.01. (a) What is the level of significance? State the null and alternate hypotheses. O Ho: P 0.5 O Ho: P = 0.5; H₁: p 5 and nq > 5. O The Student's t, since np > 5 and ng > 5. The standard normal, since np < 5 and nq < 5. O The Student's t, since np < 5 and nq < 5. What is the value of the sample test statistic? (Round…arrow_forwardA warehouse manager wants to know if there is an association between the shift worked and being on time for work. To investigate, he selects a random sample of 70 workers and classifies each one according to the shift they worked most recently and whether they were on time for work. He was unable to classify a substantial number of people as being on time, so he classified those individuals as unknown. The data are displayed in the table. The manager would like to know if these data provide convincing evidence of an association between the shift worked and being on time in the large population of all workers at this warehouse. The random and 10% conditions are met. Is the Large Counts condition met? Yes, the smallest expected count is 5, so all expected counts are at least 5. Yes, the smallest expected count is 8.54, so all expected counts are at least 5. No, the smallest expected count is 2.56, so the expected counts are not all at least 5. No, the smallest expected count is…arrow_forward
- These 2 questions go hand to handarrow_forwardA beer store wanted to test the difference on drinking habits if a younger group of 21-30 years old (n=8) to an older group of 50 to 60 years old (n=10). The store took a survey of beers per year each person had in both groups and found the following data: 21-30 group 50-60 group 50 35 17 64 25 39 88 75 53 61 62 89 36 45 29 35 29 78 State the hypotheses of the study.b. Find the critical t value for this study at an alpha level at α=.05.c. Compute the independent t testd. If significant, perform a percentage of variance test.e. State the results in APA format (numbers and words) and don’t forget to include all parts in the sentence and the direction of the results.arrow_forwardA study was conducted to determine whether big-city and small-town dwellers differed in their helpfulness to strangers. In this study, the investigators rang the doorbells of strangers living in a large City or small towns in the vicinity. They explained they had misplaced the address of a friend living in the neighbourhood and asked to use the phone. The following data show the number of individuals who admitted or did not admit the strangers (the investigators) into their homes: Helpfulness to strangers Admitted strangers into their home Didnot admit strangers into their home Big city dwellers 60 90 Small town dwellers 70 30 State the dependent and independent variable Is this a directional or non directionalarrow_forward
- A group of people use an app to track their work outs in the gym everyday. The workouts can be categorized as Strenuous, Moderate, or Light. When the data from the app was reviewed, the following observation was made: Of the people who work out strenuously on a particular day, 40% will work out strenuously the next day and 60% will work out moderately. Of the people who work out moderately on a particular day, 50% will work out strenuously the next day and 50% will work out lightly. Of the people working out lightly on a particular day, 30% will work out strenuously on the next day, 20% will work out moderately, and 50% lightly. (a) Set up the 3 x 3 transition matrix with rows and columns labelled S , M, and L. (b) Suppose that on a particular Monday, 80% work out strenuously, 10% moderately, and 10% lightly. What will the distribution be on Wednesday? (You can use a calculator for the matrix multiplication.) (c) Find the stable distribution algebraically.arrow_forwardA samll town installed a Blue streetlights, in part, to help reduce crime in particular areas. The city collected the number of property crimes along nine randomly selected streets in the month before and after the Blue light installation, and claims that crime has been reduced.The number of crime data is shown in the table. No before Blue Light After Blue Light 1 17 14 2 25 20 3 10 14 4 14 12 5 16 8 6 34 35 7 32 27 8 21 18 9 14 12 a. Specify the competing hypotheses to test the s,all town's claim.b. Calculate the value of the relevant test statistic and find the critical value at the 5% significance level.c. Does the evidence support the small town's claim at the 5% significance level?arrow_forward
arrow_back_ios
arrow_forward_ios
Recommended textbooks for you
- MATLAB: An Introduction with ApplicationsStatisticsISBN:9781119256830Author:Amos GilatPublisher:John Wiley & Sons Inc
 Probability and Statistics for Engineering and th...StatisticsISBN:9781305251809Author:Jay L. DevorePublisher:Cengage Learning
 Statistics for The Behavioral Sciences (MindTap C...StatisticsISBN:9781305504912Author:Frederick J Gravetter, Larry B. WallnauPublisher:Cengage Learning
  Elementary Statistics: Picturing the World (7th E...StatisticsISBN:9780134683416Author:Ron Larson, Betsy FarberPublisher:PEARSON
 The Basic Practice of StatisticsStatisticsISBN:9781319042578Author:David S. Moore, William I. Notz, Michael A. FlignerPublisher:W. H. Freeman
 Introduction to the Practice of StatisticsStatisticsISBN:9781319013387Author:David S. Moore, George P. McCabe, Bruce A. CraigPublisher:W. H. Freeman
MATLAB: An Introduction with Applications
Statistics
ISBN:9781119256830
Author:Amos Gilat
Publisher:John Wiley & Sons Inc
Probability and Statistics for Engineering and th...
Statistics
ISBN:9781305251809
Author:Jay L. Devore
Publisher:Cengage Learning
Statistics for The Behavioral Sciences (MindTap C...
Statistics
ISBN:9781305504912
Author:Frederick J Gravetter, Larry B. Wallnau
Publisher:Cengage Learning
Elementary Statistics: Picturing the World (7th E...
Statistics
ISBN:9780134683416
Author:Ron Larson, Betsy Farber
Publisher:PEARSON
The Basic Practice of Statistics
Statistics
ISBN:9781319042578
Author:David S. Moore, William I. Notz, Michael A. Fligner
Publisher:W. H. Freeman
Introduction to the Practice of Statistics
Statistics
ISBN:9781319013387
Author:David S. Moore, George P. McCabe, Bruce A. Craig
Publisher:W. H. Freeman