Glencoe Algebra 1, Student Edition, 9780079039897, 0079039898, 2018
18th Edition
ISBN: 9780079039897
Author: Carter
Publisher: McGraw Hill
expand_more
expand_more
format_list_bulleted
Question

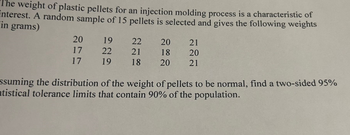
Transcribed Image Text:The weight of plastic pellets for an injection molding process is a characteristic of
interest. A random sample of 15 pellets is selected and gives the following weights
in grams)
22770
17
19
22
21
222
2222
17
19
18
18
2220
21
222
20
21
ssuming the distribution of the weight of pellets to be normal, find a two-sided 95%
atistical tolerance limits that contain 90% of the population.
Expert Solution
This question has been solved!
Explore an expertly crafted, step-by-step solution for a thorough understanding of key concepts.
Step by stepSolved in 2 steps

Knowledge Booster
Similar questions
- sion Making home > 5.2: Hypothesis test for a population mean ISION TON Uhe 7-test?Y Ho lypothesis test for a population mean. 9 Jump to level 1 A factory that manufactures bolts is performing a quality control experiment. Each object should have a length of no more than 20 centimeters. The factory believes that the length of the bolts exceeds this value and measures the length of 59 bolts. The sample mean]bolt length was 20.05 centimeters. The population standard deviation is known to be o = 0.16 centimeters. What is the test statistic z? Ex: 1.23= What is the p-value? Ex. 0.123 Does sufficient evidence exist that the length of bolts is actually greater than Select the mean value at a significance level of a = 0.05?! Check Next MESA 81101 2 hparrow_forwardA random sample of 100 4-oz packs of roasted peanuts yields an average weight of 3.91 oz. Assume that the s.d. of this brand of 4-oz packs of roasted peanuts is 0.35 oz. Does this sampling result suggest that the overall average weight of this brand of 4-oz packs of roasted peanuts is below 4 oz? Use an appropriate p-value to draw and explain your conclusionsarrow_forwardI need help with last partarrow_forward
- Suppose that a customer is purchasing a car. He conducts an experiment in which he puts 10 gallons of gas in the car and drives it until it runs out of gas. He conducts this experiment 15 times on each car and records the number of miles driven. 1.) Describe each data set, that is determine the shape, center, and spread. Sample mean for Car 1 x=enter your response here mi / 10 gal (Type an integer or decimal rounded to one decimal place as needed.) Sample mean for Car 2 x=enter your response here mi / 10 gal (Type an integer or decimal rounded to one decimal place as needed.) Median for Car 1 M=enter your response here mi / 10 gal (Type an integer or decimal rounded to one decimal place as needed.) Median for Car 2 M=enter your response here mi / 10 gal (Type an integer or decimal rounded to one decimal place as needed.) Range for Car 1 R=enter your response here mi / 10 gal (Type an integer or decimal rounded to one decimal place as needed.) Range for…arrow_forwardA test was conducted of two overnight mail delivery services. Two samples of identical deliveries were set up so that both delivery services were notified of the need for a delivery at the same time. The hours required to make each delivery follow. Do the data shown suggest a difference in the delivery times for the two services? Use a .05 le of significance for the test. Use Table 1 of Appendix B. Click on the datafile logo to reference the data. DATA file Service Delivery 1 2 24.5 26.0 28.0 21.0 18.0 36.0 25.0 21.0 24.0 26.0 31.0 28.0 25.5 32.0 20.0 19.5 28.0 29.0 22.0 23.5 29.5 30.0 3 4 6. 9. 10 11 What is the z-statistic? If required, round your answer to two decimal places. Enter negative values as negative number, if necessary. .30 What is the p-value? If required, round your answer to two decimal places. .7642 Conclude:arrow_forwardThe contents of 10 similar containers of a commercial soap are 10.2, 9.7, 10.1, 10.3, 10.1, 9.8, 9.9, 10.4, 10.3 and 9.8 liters. Assume that the soap content measurements follow an approximate normal distribution. What is the margin of error using a 95% level of confidence?arrow_forward
- WILL THUMBS UP IF CORRECT.arrow_forwardTo estimate the mean amount of paint in all 1-gal cans with 95% confidence to within .004 gals, what sample size is required?arrow_forwardListed below are systolic blood pressure measurements (mm Hg) taken from the right and left arms of the same woman. Assume that the paired sample data is a simple random sample and that the differences have a distribution that is approximately normal. Use a 0.05 significance level to test for a difference between the measurements from the two arms. Identify the test statistic and p-value. Right arm Left arm 147 170 131 127 139 166 192 O A. T = -4.01, p-value = 0.016 OB. T = -2.32, p-value = 0.081 O C. T = -3.07, p-value = 0.037 139 136 139 D.T=-1.93, p-value = 0.127 Sarrow_forward
arrow_back_ios
arrow_forward_ios
Recommended textbooks for you
 Glencoe Algebra 1, Student Edition, 9780079039897...AlgebraISBN:9780079039897Author:CarterPublisher:McGraw Hill
 College Algebra (MindTap Course List)AlgebraISBN:9781305652231Author:R. David Gustafson, Jeff HughesPublisher:Cengage Learning

Glencoe Algebra 1, Student Edition, 9780079039897...
Algebra
ISBN:9780079039897
Author:Carter
Publisher:McGraw Hill

College Algebra (MindTap Course List)
Algebra
ISBN:9781305652231
Author:R. David Gustafson, Jeff Hughes
Publisher:Cengage Learning