MATLAB: An Introduction with Applications
6th Edition
ISBN: 9781119256830
Author: Amos Gilat
Publisher: John Wiley & Sons Inc
expand_more
expand_more
format_list_bulleted
Question

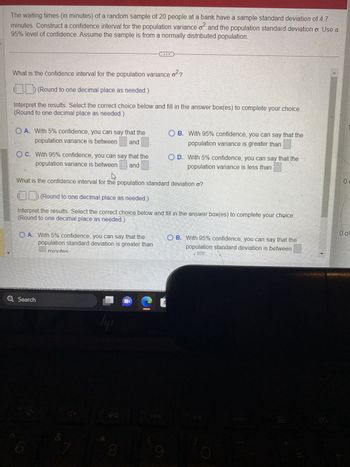
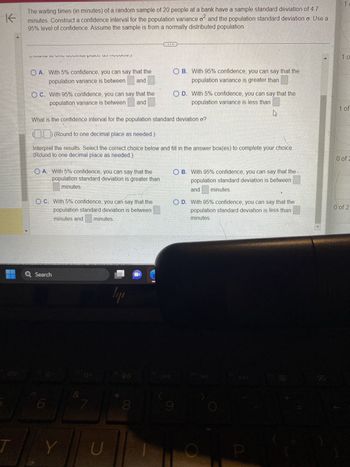
Transcribed Image Text:The waiting times (in minutes) of a random sample of 20 people at a bank have a sample standard deviation of 4.7
0²
minutes. Construct a confidence interval for the population variance of and the population standard deviation o. Use a
95% level of confidence. Assume the sample is from a normally distributed population.
What is the confidence interval for the population variance of
0²2
(Round to one decimal place as needed.)
Interpret the results. Select the correct choice below and fill in the answer box(es) to complete your choice.
(Round to one decimal place as needed.)
OA. With 5% confidence, you can say that the
population variance is between and
OC. With 95% confidence, you can say that the
population variance is between and
4
What is the confidence interval for the population standard deviation o?
OA. With 5% confidence, you can say that the
population standard deviation is greater than
minutes
(___) (Round to one decimal place as needed.)
Interpret the results. Select the correct choice below and fill in the answer box(es) to complete your choice.
(Round to one decimal place as needed.)
Q Search
4-
&
4+
7
ly
VA B
90
8
N
OB. With 95% confidence, you can say that the
population variance is greater than
C
O D. With 5% confidence, you can say that the
population variance is less than
9
OB. With 95% confidence, you can say that the
population standard deviation is between
LE
Ø
00
0 of
Expert Solution
This question has been solved!
Explore an expertly crafted, step-by-step solution for a thorough understanding of key concepts.
Step by stepSolved in 4 steps with 28 images

Knowledge Booster
Similar questions
- A statistics practitioner took a random sample of 55 observations from a population whose standard deviation is 28 and computed the sample mean to be 110. Note: For each confidence interval, enter your answer in the form (LCL, UCL). You must include the parentheses and the comma between the confidence limits. A. Estimate the population mean with 95% confidence. Confidence Interval =| B. Estimate the population mean with 90% confidence. Confidence Interval = C. Estimate the population mean with 99% confidence. Confidence Interval =arrow_forwardConstruct the confidence interval for the population mean. If the sample size is 35, the sample mean is 4.8, and the sample standard deviation is 2.2. We also know that the population standard deviation is 2.6. Use the Confidence Level = 95%. Use parentheses and four decimal places.arrow_forwardFind the 90% confidence interval for the variance and standard deviation of the ages of students at Arcanum high school if a sample of 24 students has a standard deviation of 2.3 years. Assume the variable is normally distributed.arrow_forward
- You are given the sample mean and the population standard deviation. Use this information to construct the 90% and 95% confidence intervals for the population mean. Interpret the results and compare the widths of the confidence intervals. From a random sample of 65 dates, the mean record high daily temperature in a certain city has a mean of 84.70°F. Assume the population standard deviation is 14.54°F.arrow_forwardScores of each of the Knitting Aptitude tests were normally distributed with a mean of 6 hours and a standard deviation of 1.67 hours. Carrie will be taking the test tomorrow. Assume the data is normally distributed. Determine the probability of someone finishing in less than 2.17 hours 0.9891 0.5000 1.0 0.0109arrow_forwardA standardized exam's scores are normally distributed. In a recent year, the mean test score was 1522 and the standard deviation was 311. The test scores of four students selected at random are 1950, 1260, 2190, and 1410. Find the z-scores that correspond to each value and determine whether any of the values are unusual. The z-score for 1950 is. (Round to two decimal places as needed.)arrow_forward
- Assume that adults have IQ scores that are normally distributed with a mean of 97.2 and a standard deviation 21.8. Find the first quartile Q₁, which is the IQ score separating the bottom 25% from the top 75%. (Hint: Draw a graph.) The first quartile is. (Type an integer or decimal rounded to one decimal place as needed.)arrow_forwardA random sample of 64 shoppers showed that they spend an average of $27.31 per visit at the Sunday Mornings Bookstore. The standard deviation of the population is $2.14. Find the 90% confidence interval of the true mean. Please include all work showing how you found your answer.arrow_forwardA standardized exam's scores are normally distributed. In a recent year, the mean test score was 1458 and the standard deviation was 312. The test scores of four students selected at random are 1860, 1220, 2150, and 1340. Find the z-scores that correspond to each value and determine whether any of the values are unusual. The z-score for 1860 is (Round to two decimal plaes as needed.)arrow_forward
arrow_back_ios
arrow_forward_ios
Recommended textbooks for you
 MATLAB: An Introduction with ApplicationsStatisticsISBN:9781119256830Author:Amos GilatPublisher:John Wiley & Sons Inc
 Probability and Statistics for Engineering and th...StatisticsISBN:9781305251809Author:Jay L. DevorePublisher:Cengage Learning
 Statistics for The Behavioral Sciences (MindTap C...StatisticsISBN:9781305504912Author:Frederick J Gravetter, Larry B. WallnauPublisher:Cengage Learning
 Elementary Statistics: Picturing the World (7th E...StatisticsISBN:9780134683416Author:Ron Larson, Betsy FarberPublisher:PEARSON
 The Basic Practice of StatisticsStatisticsISBN:9781319042578Author:David S. Moore, William I. Notz, Michael A. FlignerPublisher:W. H. Freeman
 Introduction to the Practice of StatisticsStatisticsISBN:9781319013387Author:David S. Moore, George P. McCabe, Bruce A. CraigPublisher:W. H. Freeman

MATLAB: An Introduction with Applications
Statistics
ISBN:9781119256830
Author:Amos Gilat
Publisher:John Wiley & Sons Inc

Probability and Statistics for Engineering and th...
Statistics
ISBN:9781305251809
Author:Jay L. Devore
Publisher:Cengage Learning

Statistics for The Behavioral Sciences (MindTap C...
Statistics
ISBN:9781305504912
Author:Frederick J Gravetter, Larry B. Wallnau
Publisher:Cengage Learning

Elementary Statistics: Picturing the World (7th E...
Statistics
ISBN:9780134683416
Author:Ron Larson, Betsy Farber
Publisher:PEARSON

The Basic Practice of Statistics
Statistics
ISBN:9781319042578
Author:David S. Moore, William I. Notz, Michael A. Fligner
Publisher:W. H. Freeman

Introduction to the Practice of Statistics
Statistics
ISBN:9781319013387
Author:David S. Moore, George P. McCabe, Bruce A. Craig
Publisher:W. H. Freeman