MATLAB: An Introduction with Applications
6th Edition
ISBN: 9781119256830
Author: Amos Gilat
Publisher: John Wiley & Sons Inc
expand_more
expand_more
format_list_bulleted
Concept explainers
Topic Video
Question
thumb_up100%

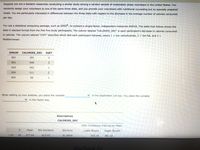
Transcribed Image Text:Suppose you are a bariatric researcher conducting a similar study among a random sample of moderately obese volunteers in the United States. You
randomly assign your volunteers to one of the same three diets, and you provide your volunteers with nutritional counseling but no specially prepared
meals. You are particularly interested in differences between the three diets with respect to the decrease in the average number of calories consumed
per day.
You use a statistical computing package, such as SPSS®, to conduct a single-factor, independent-measures ANOVA. The table that follows shows the
data in stacked format from the first five study participants. The column labeled "CALORIES_DEC" is each participant's decrease in calories consumed
in calories. The column labeled "DIET" describes which diet each participant followed, where 1 = low carbohydrate, 2 = low fat, and 3 =
Mediterranean.
IDNUM
CALORIES_DEC
DIET
001
201
2
002
659
003
452
1
004
211
2
005
56
1
When setting up your analysis, you place the variable
in the Dependent List box. You place the variable
v in the Factor box.
Descriptives
CALORIES_DEC
95% Confidence Interval for Mean
Mean
Std Deviation
Std Error
Lower Bound
Upper Bound
1.00
45
377.64
413.53
61.6454
373.75
381.53
MacBook Air

Transcribed Image Text:"paring
1More Means. interppreting SPSS
TICMIT
LUTFG T 0 IM
1.00
45
377.64
413.53
61.6454
373.75
381.53
2.00
41
576.21
231.24
36.1136
573.93
578.49
Is
3.00
453.45
42
244.73
37.7627
451.07
455.83
Total
128
466.12
319.63
28.252
466.0568
466.1824
ANOVA
Sum of Squares
df
Mean Square
F
Sig
Between Groups
855,946.31
2
427973.16
4.41
0.0141
Within Groups
12,118,791.87
125
96950.33
Total
12,974,738.18
127
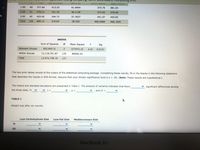
The two prior tables consist of the output of the statistical computing package. Considering these results, fill in the blanks in the following statement
that describes the results in APA format. Assume that your chosen significance level is a = .05. (Note: These results are hypothetical.)
The means and standard deviations are presented in Table 1. The analysis of variance indicates that there
v significant differences among
the three diets, F(▼
p =
,and n2 =
TABLE 1
Weight loss after six months
Low-Carbohydrate Diet
Low-Fat Diet
Mediterranean Diet
M
SD
MacBook Air
Expert Solution
This question has been solved!
Explore an expertly crafted, step-by-step solution for a thorough understanding of key concepts.
This is a popular solution
Trending nowThis is a popular solution!
Step by stepSolved in 3 steps with 1 images

Knowledge Booster
Learn more about
Need a deep-dive on the concept behind this application? Look no further. Learn more about this topic, statistics and related others by exploring similar questions and additional content below.Similar questions
- What are the values for SS and variance for the following sample of n = 3 scores? Sample: 8, 5, 2arrow_forward2) Researchers are interested in whether there is any relationship between a person's IQ (x- variable) and how long they live (y-variable). Answer the questions below by using the data provided. Show your work and use the back of the page if necessary. X Y 10 3 6. 6. 7 4 3 4 a) What type of statistical analysis would be most appropriate to use in this scenario? Please justify your answer. b) Please state the null and alternative hypotheses. c) Please report the results of your statistical analyses and make a decision about whether to reject or fail to reject the null hypothesis Use alpha = .05 (two-tailed). %3Darrow_forwardConsider the following research questions/study scenarios. For each study, discuss the most appropriate methods for describing the data (graphically and numerically). What statistical method would be most appropriate for addressing the research questions? Be sure to provide a justification of the statistical method. What statistical test is needed, provide appropriate null and research hypotheses. An investigation of the association between drink preferences and the color of teeth is proposed. Subjects will be surveyed as to the type of drink most often consumed (coffee/tea. Juice, caramel-colored soda, water, or milk). A clinical exam will be performed after dental cleaning to determine the color of the teeth (reddish brown, reddish yellow, gray, reddish gray).arrow_forward
- Use the attached table to answer the following: What is the dependent (response, outcome) variable? What is the independent (explanatory) variable? Describe the pattern of association between subjective class and satisfaction with financial situation.arrow_forwardChoose the appropriate statistical test. When computing, be sure to round each answer as indicated. A dentist wonders if depression affects ratings of tooth pain. In the general population, using a scale of 1-10 with higher values indicating more pain, the average pain rating for patients with toothaches is 6.8. A sample of 30 patients that show high levels of depression have an average pain rating of 7.1 (variance 0.8). What should the dentist determine? 1. Calculate the estimated standard error. (round to 3 decimals). [st.error] 2. What is thet-obtained? (round to 3 decimals). 3. What is the t-cv? (exact value) 4. What is your conclusion? Only type "Reject" or Retain"arrow_forwardThe accompanying table lists pulse rates. Use a 0.05 significance level and apply the methods of two-way analysis of variance. What is the conclusion? Click on the icon to view the data table. C State the null and alternative hypotheses in the test for the effect of an interaction between row and column factors. Ho: There is no interaction between gender and age. H₁: There is an interaction between gender and age. What is the value of the test statistic for this test? F = 3.32 (Round to two decimal places as needed.) What is the corresponding P-value of the test statistic, F, for this P-value= (Round to three decimal places as needed.) Pulse Rates for Gender and Age Over 30 Years of Age Under 30 Years of Age Female 78 103 78 63 61 98 81 98 91 95 77 75 73 65 71 78 61 71 74 55 Female Male 60 81 56 69 68 74 75 68 63 56 46 70 61 65 91 80 59 58 64 59 Male D Xarrow_forward
- Given below are the analysis of variance results from a stat software display comparing sample data for the meanmileage for 4 different types of cars. Assume that you want to use a 0.05 significance level in testing the null hypothesisthat the different samples come from cars with the same mileage. What can you conclude about the equality of the population means?Source DF SS MS F pFactor 3 13.500 4.500 5.17 0.011Error 16 13.925 0.870Total 19 27.425 12)What is the null and alternative hypothesis for this scenari?Based on this One Way Anova software analysis, would you reject of fail to reject the nul hypothesis?What does this result mean in context?arrow_forwardQuestion 16: Please use the approporate stats table attached. Do not use a software for this problem.a. What was the observed difference between the mean PCV levels for the two groups? b.Assuming that the two groups have similar variances, estimate the standard error of the difference between the sample means c. Conduct an appropriate test to assess the difference between the two means. What do you conclude?arrow_forwardThe better-selling candies are often high in calories. Assume that the following data show the calorie content from samples of M&M's, Kit Kat, and Milky Way II. M&M's Kit Kat Milky Way II 240 235 200 210 205 208 220 245 202 250 215 190 240 230 180 Test for significant differences among the calorie content of these three candies. State the null and alternative hypotheses. O H: MedianMM - MedianK = Median Mw H: Median MM * MedianKK + MedianMw O Ho: MedianMM = MediankK = Median Mw H: Median MM > Median KK > MedianMw O H.: Not all populations of calories are identical. H: All populations of calories are identical. O Ho: All populations of calories are identical. H: Not all populations of calories are identical. O Ho: MedianMM * MedianKk + MedianMw 'MW H: MedianMM = Mediankk = MedianMw Find the value of the test statistic. (Round your answer to two decimal places.) 8.62 Find the p-value. (Round your answer to three decimal places.) p-value =.005 At a 0.05 level of significance, what is your…arrow_forward
- Given below are the analysis of variance results from a Minitab display. Assume that you want to use a 0.05 significance level in testing the null hypothesis that the different samples come from populations with the same mean. Identify the value of the test statistic. Source DF MS F Factor 3 13.500 4.500 5.17 0.011 Error 16 13.925 0.870 Total 19 27.425 Seleccione una: O A. 5.17 О В. 0.011 O C. 4.500 O D. 13.500arrow_forwardThe article cited in Exercise 19 provides measures of electrical conductivity (in uS/cm). The results are presented in the following table. Sample Size 49 Location Mean SD Upstream 463 208 Midstream 363 98 31 Downstream 647 878 30 Can a one-way analysis of variance be used to determine whether conductivity varies with location? Or is one of the necessary assumptions violated? Explain.arrow_forward
arrow_back_ios
arrow_forward_ios
Recommended textbooks for you
 MATLAB: An Introduction with ApplicationsStatisticsISBN:9781119256830Author:Amos GilatPublisher:John Wiley & Sons Inc
 Probability and Statistics for Engineering and th...StatisticsISBN:9781305251809Author:Jay L. DevorePublisher:Cengage Learning
 Statistics for The Behavioral Sciences (MindTap C...StatisticsISBN:9781305504912Author:Frederick J Gravetter, Larry B. WallnauPublisher:Cengage Learning
 Elementary Statistics: Picturing the World (7th E...StatisticsISBN:9780134683416Author:Ron Larson, Betsy FarberPublisher:PEARSON
 The Basic Practice of StatisticsStatisticsISBN:9781319042578Author:David S. Moore, William I. Notz, Michael A. FlignerPublisher:W. H. Freeman
 Introduction to the Practice of StatisticsStatisticsISBN:9781319013387Author:David S. Moore, George P. McCabe, Bruce A. CraigPublisher:W. H. Freeman

MATLAB: An Introduction with Applications
Statistics
ISBN:9781119256830
Author:Amos Gilat
Publisher:John Wiley & Sons Inc

Probability and Statistics for Engineering and th...
Statistics
ISBN:9781305251809
Author:Jay L. Devore
Publisher:Cengage Learning

Statistics for The Behavioral Sciences (MindTap C...
Statistics
ISBN:9781305504912
Author:Frederick J Gravetter, Larry B. Wallnau
Publisher:Cengage Learning

Elementary Statistics: Picturing the World (7th E...
Statistics
ISBN:9780134683416
Author:Ron Larson, Betsy Farber
Publisher:PEARSON

The Basic Practice of Statistics
Statistics
ISBN:9781319042578
Author:David S. Moore, William I. Notz, Michael A. Fligner
Publisher:W. H. Freeman

Introduction to the Practice of Statistics
Statistics
ISBN:9781319013387
Author:David S. Moore, George P. McCabe, Bruce A. Craig
Publisher:W. H. Freeman