
MATLAB: An Introduction with Applications
6th Edition
ISBN: 9781119256830
Author: Amos Gilat
Publisher: John Wiley & Sons Inc
expand_more
expand_more
format_list_bulleted
Related questions
Concept explainers
Topic Video
Question
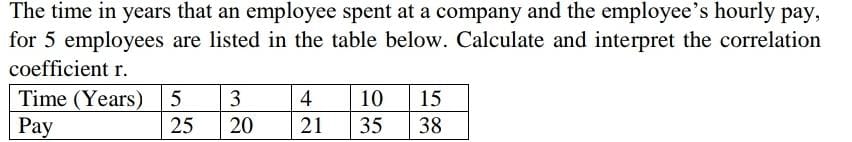

Transcribed Image Text:The time in years that an employee spent at a company and the employee's hourly pay,
for 5 employees are listed in the table below. Calculate and interpret the correlation
coefficient r.
Time (Years) 5
Pay
3
4
10
15
25
20
21
35
38
Expert Solution
This question has been solved!
Explore an expertly crafted, step-by-step solution for a thorough understanding of key concepts.

This is a popular solution

Trending nowThis is a popular solution!

Step by stepSolved in 2 steps with 4 images

Knowledge Booster


Learn more about
Need a deep-dive on the concept behind this application? Look no further. Learn more about this topic, statistics and related others by exploring similar questions and additional content below.Similar questions
- answer this please thankyouuuarrow_forwardLet x be the average number of employees in a group health insurance plan, and let y be the average administrative cost as a percentage of claims. x 3 7 15 32 75 y 40 35 30 26 18 (a) Make a scatter diagram of the data and visualize the line you think best fits the data. Flash Player version 10 or higher is required for this question. You can get Flash Player free from Adobe's website. (b) Would you say the correlation is low, moderate, or strong? positive or negative? strong and negative moderate and negative strong and positive low and negative low and positive moderate and positive (c) Use a calculator to verify that Σx = 132, Σx2 = 6932, Σy = 149, Σy2 = 4725, and Σxy = 2997. Compute r. (Round your answer to three decimal places.)r = As x increases, does the value of r imply that y should tend to increase or decrease? Explain. Given our value of r, we cannot draw any conclusions for the behavior of y as x increases. Given our value of r, y should tend to…arrow_forwardUsing technology, what is the correlation coefficient? The weight (in pounds) and height (in inches) for a child were measured every few months over a two-year period. The results are given in the table. O -0.997 O -0.503 Weight (x) 8. 12 18 24 30 32 35 37 40 O 0.503 Height (y) 22 23 26 30 32 33 5 36 38 O 0.997arrow_forward
- Fully explain the issues and problems with the below correlational data. Focus on the data in the highlighted box versus the rest of the data. Do not try to explain the data, but rather focus on the statistical issues and problems. IF YOU CAN'T SEE THE IMAGE HERE. PLEASE GO TO THIS LINK Linke 10 6. 8. 7. 5. 4. 10 20 30 40 50 60 70 80 90 100 Age Enjoyment of Hip-Hoparrow_forwardGiven the graph below, what type of correlation would you predict there is between the variables? CAR PRICE DEPENDING ON AGE Price (dollars) 10000 9000 8000 7000 6000 5000 4000 3000 2000 1000- 4. 10 Age (years) O Positive correlation O Negative correlation O No correlationarrow_forwardThe correlation between amount of sleep students get the night before the test and their performance shows that the less sleep they get the lower their grades. This would be an example of Group of answer choices no correlation a negative correlation a spurious correlation a positive correlationarrow_forward
arrow_back_ios
arrow_forward_ios
Recommended textbooks for you
- MATLAB: An Introduction with ApplicationsStatisticsISBN:9781119256830Author:Amos GilatPublisher:John Wiley & Sons Inc
 Probability and Statistics for Engineering and th...StatisticsISBN:9781305251809Author:Jay L. DevorePublisher:Cengage Learning
 Statistics for The Behavioral Sciences (MindTap C...StatisticsISBN:9781305504912Author:Frederick J Gravetter, Larry B. WallnauPublisher:Cengage Learning
  Elementary Statistics: Picturing the World (7th E...StatisticsISBN:9780134683416Author:Ron Larson, Betsy FarberPublisher:PEARSON
 The Basic Practice of StatisticsStatisticsISBN:9781319042578Author:David S. Moore, William I. Notz, Michael A. FlignerPublisher:W. H. Freeman
 Introduction to the Practice of StatisticsStatisticsISBN:9781319013387Author:David S. Moore, George P. McCabe, Bruce A. CraigPublisher:W. H. Freeman
MATLAB: An Introduction with Applications
Statistics
ISBN:9781119256830
Author:Amos Gilat
Publisher:John Wiley & Sons Inc
Probability and Statistics for Engineering and th...
Statistics
ISBN:9781305251809
Author:Jay L. Devore
Publisher:Cengage Learning
Statistics for The Behavioral Sciences (MindTap C...
Statistics
ISBN:9781305504912
Author:Frederick J Gravetter, Larry B. Wallnau
Publisher:Cengage Learning
Elementary Statistics: Picturing the World (7th E...
Statistics
ISBN:9780134683416
Author:Ron Larson, Betsy Farber
Publisher:PEARSON
The Basic Practice of Statistics
Statistics
ISBN:9781319042578
Author:David S. Moore, William I. Notz, Michael A. Fligner
Publisher:W. H. Freeman
Introduction to the Practice of Statistics
Statistics
ISBN:9781319013387
Author:David S. Moore, George P. McCabe, Bruce A. Craig
Publisher:W. H. Freeman