
A First Course in Probability (10th Edition)
10th Edition
ISBN: 9780134753119
Author: Sheldon Ross
Publisher: PEARSON
expand_more
expand_more
format_list_bulleted
Related questions
Question
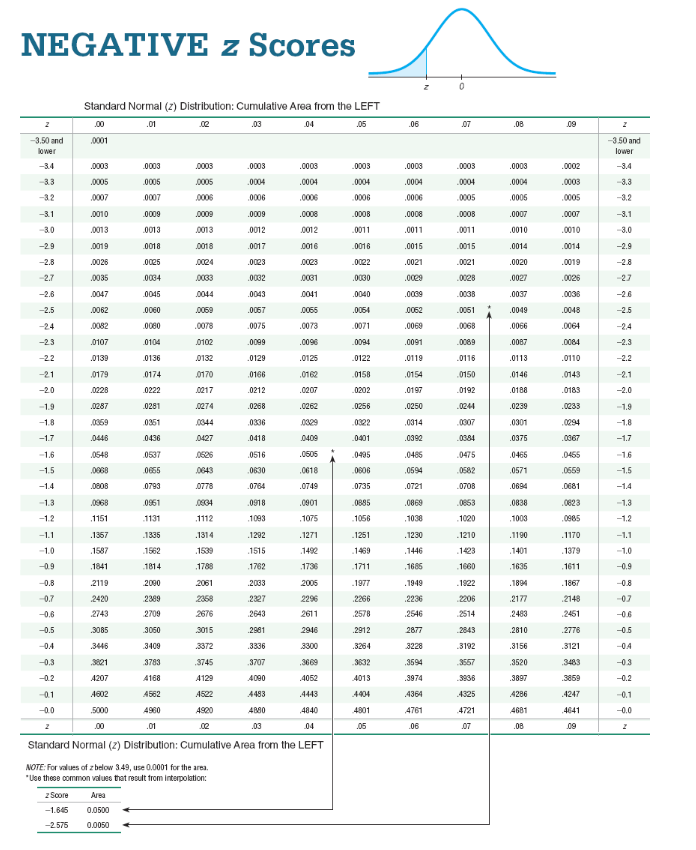
The test statistic of z= -16.8 is obtained when testing the claim that p= 1/2
a. Using a significance level of α=0.01, find the critical value(s).
b. Should we reject H0 or should we fail to reject H0?

Transcribed Image Text:NEGATIVE z Scores
2
-3.50 and
lower
-3.4
-3.3
-3.2
-3.1
-3.0
-2.9
-2.8
-2.7
-2.6
-2.5
-24
-2.3
-22
-21
-20
-1.9
-1.8
-1.7
-1.6
-1.5
-1.4
-1.3
-1.2
-1.1
-1.0
-0.9
-0.8
-0.7
-0.6
-0.5
-0.3
-0.2
-0.1
-0.0
2
Standard Normal (2) Distribution: Cumulative Area from the LEFT
.00
.01
.02
.03
04
.05
0001
.0003
0005
0007
z Score
-1.645
-2.575
.0010
.0013
.0019
.0026
0035
.0047
.0062
0082
.0107
.0139
0179
0228
0287
0359
0446
0548
.0068
0808
0968
1151
.1357
1587
.1841
2119
.2420
2743
3085
.3446
3821
4207
4602
5000
.00
0003
0005
0007
.0009
0013
0018
0025
0034
0.0500
0.0050
0045
.0060
0060
0104
0136
0174
0222
0281
0351
0436
0537
0655
0793
0961
1131
1335
1562
1814
2000
2389
2709
3060
3409
0003
0005
0006
.0009
0013
0018
0024
0033
0044
.0059
.0078
0102
0132
0170
0217
0274
0344
0427
0526
0643
0778
0934
1112
.1314
.1539
.1788
2061
2358
2676
3015
3372
NOTE: For values of z below 3.49, use 0.0001 for the area.
*Use these common values that result from interpolation:
.0003
.0004
0006
.0009
0012
.0017
.0023
.0032
0043
.0067
.0075
.0099
0129
0166
0212
.0268
.0336
0418
0516
.0630
.0764
0918
.1093
.1292
1515
.1762
2033
2327
2643
.2981
3336
3707
4090
4483
4880
.03
.0003
.0004
.0006
.0008
0012
0016
0023
0031
0041
0065
.0073
.0096
.0125
.0162
.0207
.0262
0329
0409
3783
.3745
4168
4129
4562
4522
4960
4920
.01
.02
Standard Normal (2) Distribution: Cumulative Area from the LEFT
.0605
.0618
.0749
.0901
.1075
.1271
1492
1736
2005
2296
2611
2946
3300
3669
4052
4443
4840
04
.0003
.0004
.0006
.0008
.0011
.0016
.0022
0030
.0040
.0054
.0071
0094
0122
.0158
0202
0256
0322
0401
0495
0806
0735
0885
.1056
.1251
.1469
1711
.1977
2266
.2578
.2912
.3264
3632
4013
4404
4801
.05
.06
.0003
.0004
.0006
.0008
.0011
.0015
.0021
.0029
.0009
0062
.0069
.0091
.0119
.0154
.0197
.0250
.0314
.0392
.0485
.0594
.0721
.0869
.1038
1230
.1446
.1685
1949
.2236
2546
2877
3228
.3594
.3974
4364
4761
.06
to
.07
.0003
0004
.0005
.0008
.0011
.0015
.0021
.0028
00:38
.0051
.0068
.0069
.0116
0150
0192
.0244
0307
0384
0475
.0582
.0708
0853
.1020
.1210
1423
.1660
1922
2206
2514
2843
3192
3557
.3936
4325
4721
.07
.08
.0003
.0004
.0005
.0007
.0010
.0014
.0020
.0027
.0037
.0049
.0066
.0087
.0113
.0146
.0188
0239
.0301
.0375
0465
.0571
.0694
.0838
.1003
.1190
1401
.1635
.1894
2177
2483
.2810
.3156
3520
.3897
4286
4681
.08
09
.0002
.0003
.0005
.0007
.0010
.0014
.0019
.0026
.0036
.0048
.0064
.0084
.0110
.0143
.0183
0233
.0294
.0367
.0455
.0659
.0681
.0823
.0985
.1170
.1379
.1611
.1867
.2148
.2451
.2776
.3121
3483
38659
4247
4641
09
-3.50 and
lower
-3.4
-3.3
-3.2
-3.1
-3.0
-2.9
-2.8
-27
-2.6
-2.5
-2.4
-2.3
-2.2
-2.1
-2.0
-1.9
-1.8
-1.7
-1.6
-1.5
-1.4
-1.3
-1.2
-1.1
-1.0
-0.9
-0.8
-0.7
-0.6
-0.5
-0.4
-0.3
-0.2
-0.0

Transcribed Image Text:(1) O two-tailed
Oright-tailed
O left-tailed
Standard Normal (2) Distribution: Cumulative Area from the LEFT
.04
z
0.0
0.1
02
0.3
0.4
0.5
0.6
0.7
0.8
0.9
1.0
1.1
1.2
1.3
1.4
1.5
1.6
1.7
18
1.9
20
2.1
22
2.3
2.4
2.5
26
2.7
2.8
2.9
3.0
3.1
32
3.3
3.50 and up
2
00
5000
5388
5793
.6179
.6554
6915
7257
7580
.7881
.8159
8413
.8643
zScore
1.645
2.575
9032
.9192
.8332
9452
9554
9713
.9772
9821
.9861
0803
9018
9038
9963
.9965
.9974
9961
9967
9000
9005
9999
.00
.01
5040
5438
5832
6217
6991
6950
7291
7811
.7910
8186
8430
3666
3809
9049
9207
9345
Area
0.9500
0.9950
9463
3564
9649
9719
9778
9826
9064
9806
9820
9940
.9965
9966
.9975
9882
9987
.9991
9993
9996
.9997
5000
5478
5871
6255
6628
6985
7324
7842
.7939
8212
8461
0036
9006
9222
9357
9474
9556
9726
9783
9830
9888
9808
9022
.9966
9967
9976
9902
9987
9001
9005
NOTE: For values of above 3.49, use 0.9999 for the area.
*Use these common values that result from interpolation:
POSITIVE z Scores
03
5120
5617
5910
.6293
.7019
7357
7673
.7967
8238
8485
.8708
.8907
.9062
.8370
3484
1682
9732
9788
9634
.9871
1001
1025
9043
9957
.9977
9963
9968
1991
9006
9997
03
.5160
.5557
.5948
.6331
.6700
7064
7389
7704
7995
8264
8508
8729
8925
9099
9261
9382
9495
.9591
.9671
9738
.9793
.9638
.9675
9904
9927
9945
.9959
.9969
.01
De
04
Standard Normal (2) Distribution: Cumulative Area from the LEFT
.9977
.9984
.9988
9992
9994
9996
9997
.05
.6199
.5596
.5887
.6368
.6736
.7088
7422
.7734
8023
8289
8531
.8749
8944
9115
9265
8394
.9605
0600
.9678
.9744
.9798
.9642
9009
.9960
.9970
.9978
.9984
.9989
9002
9094
9006
.05
.06
5239
5636
6026
6406
.6772
7123
7454
7764
8051
8315
8770
9131
9279
9515
9608
9686
9750
9803
9646
9681
9909
9931
9048
9961
9971
9979
9985
9989
9992
9994
9996
9997
06
.07
.6279
.5675
.6064
.6443
.6308
.7157
7486
.7794
.8078
.8340
.8577
.8790
0900
9147
9292
9418
.9525
.9616
.9693
.9756
.9808
.9850
.9884
.9911
.9932
9049
.9962
.9972
.9979
.9985
.9989
9992
.9995
9996
.9997
.07
05
.5319
.5714
6103
.6450
.6844
7190
7517
.7823
8106
8355
8590
.6810
.8997
.9162
9429
0635
0625
5699
9761
.5812
.9054
.9657
0913
1034
9951
9980
9990
1903
08
.5369
.5753
.6141
.6517
.6879
7224
.7549
7852
.8133
.8389
.8621
.8630
.9015
.9177
.9319
9441
9545
.9633
9706
.9767
.9817
.9667
.9690
0.90
0.96
0.99
9016
9136
9162
9964
.9974
.9981
.9906
.9990
9193
9195
9997
.9998
.09
Common Critical Values
Confidence Critical
Level
Value
1.645
1.96
2.575
0.0
0.1
02
0.3
0.4
0.5
0.6
0.7
0.8
0.9
1.0
1.1
1.2
1.3
1.4
1.5
1.6
1.7
1.8
1.9
20
2.1
2.2
2.3
24
25
26
2.7
28
2.9
3.0
3.1
3.2
3.3
-
3.4
3.50 and up
Expert Solution
This question has been solved!
Explore an expertly crafted, step-by-step solution for a thorough understanding of key concepts.

This is a popular solution

Trending nowThis is a popular solution!

Step by stepSolved in 4 steps with 17 images

Knowledge Booster

Similar questions
- The test statistic of z=−3.21 is obtained when testing the claim that p<0.79. a. Using a significance level of α=0.05, find the critical value(s). b. Should we reject H0 or should we fail to reject H0?arrow_forwardHow do we do in excelarrow_forwardThe test statistic of z = 1.42 is obtained when testing the claim that p>0.1. A.identify the phyothesis test as being two-tailed, left-tailed, or right-tailed. B.find the p-value. C. Using a significance level of o=0.05, should we reject H0 or should we fail to reject H0?arrow_forward
- Use the given information to find the p-value. Also, use a 0.05 significance level and state the conclusion about the null hypothesis (reject the null hypothesis or fail to reject the null hypothesis). With H 1: p≠0.377, the test statistic is z=3.06.arrow_forwardThe test statistic of z=−2.31 is obtained when testing the claim that p=1/2. a. Using a significance level of α=0.05,find the critical value(s). b. Should we reject H0 or should we fail to reject H0?arrow_forwardThe test statistic of z=−2.80 is obtained when testing the claim that p<0.47. a. Using a significance level of α=0.05, find the critical value(s). b. Should we reject H0 or should we fail to reject H0?arrow_forward
- The test statistic of z=−1.83 is obtained when testing the claim that p<0.49. a. Using a significance level of α=0.01, find the critical value(s). b. Should we reject H0 or should we fail to reject H0?arrow_forwardThe probability that a trainee will remain with a company is 0.6. the probability that am employee earnsbmore than k10,000 per month is 0.5. the probability that an employee who is a trainee remained with the company or who earns more than k10,000 per month is 0.7. what is the probability that an employee earns more than k10,000 per month given that he is a trainee who stayed with the companyarrow_forwardThe NAEP considers that a national average of 283 is an acceptable performance. Using α = .05, run a two-tail t-test for one sample to test Ho: µ=283 for the 2019 scores. Report the t-obt, df, and p-values. Would you reject the null hypothesis that the 2019 scores come from a population with average 283? If this is the case, does it come from a population from larger or smaller average?arrow_forward
- The test statistic of z=−2.97 is obtained when testing the claim that p=3/5. a. Using a significance level of a=0.10, find the critical value(s). b. Should we reject H 0or should we fail to reject H 0?arrow_forwardQ1. Which of the following represents Type II error? a. Rejecting the Ho after a test statistic results in a p-value of 0.10 at α =0.05.B. Rejecting the Ho after a test statistic results in a p-value of 0.025 at α=0.05.C. None of the abovearrow_forwardThe test statistic of z=−2.15 is obtained when testing the claim that p=4/7. a. Using a significance level of α=0.01, find the critical value(s). b. Should we reject H0 or should we fail to reject H0?arrow_forward
arrow_back_ios
SEE MORE QUESTIONS
arrow_forward_ios
Recommended textbooks for you
- A First Course in Probability (10th Edition)ProbabilityISBN:9780134753119Author:Sheldon RossPublisher:PEARSON

A First Course in Probability (10th Edition)
Probability
ISBN:9780134753119
Author:Sheldon Ross
Publisher:PEARSON