
MATLAB: An Introduction with Applications
6th Edition
ISBN: 9781119256830
Author: Amos Gilat
Publisher: John Wiley & Sons Inc
expand_more
expand_more
format_list_bulleted
Related questions
Question
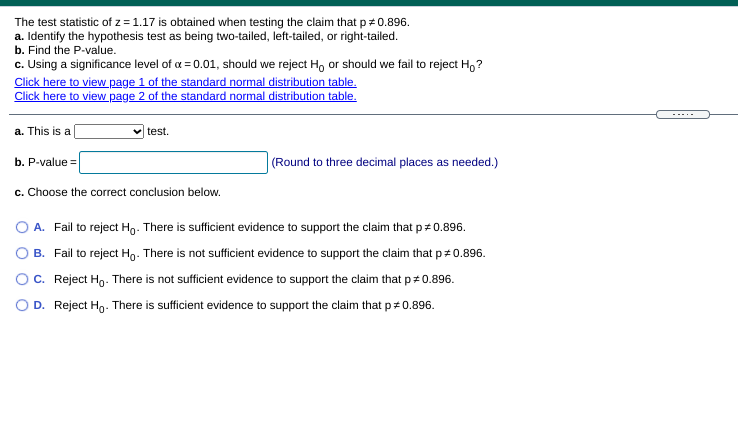

Transcribed Image Text:The test statistic of z = 1.17 is obtained when testing the claim that p 0.896.
a. Identify the hypothesis test as being two-tailed, left-tailed, or right-tailed.
b. Find the P-value.
c. Using a significance level of a = 0.01, should we reject Ho or should we fail to reject H,?
Click here to view page 1 of the standard normal distribution table.
Click here to view page 2 of the standard normal distribution table.
a. This is a
test.
b. P-value =
(Round to three decimal places as needed.)
c. Choose the correct conclusion below.
O A. Fail to reject Hg. There is sufficient evidence to support the claim that p#0.896.
B. Fail to reject Ho- There is not sufficient evidence to support the claim that p#0.896.
C. Reject H,. There is not sufficient evidence to support the claim that p 0.896.
D. Reject Ho. There is sufficient evidence to support the claim that p 0.896.
Expert Solution
This question has been solved!
Explore an expertly crafted, step-by-step solution for a thorough understanding of key concepts.

This is a popular solution

Trending nowThis is a popular solution!

Step by stepSolved in 2 steps with 2 images

Knowledge Booster

Similar questions
- The following random sample was selected from a normal distribution: 4, 6, 3, 5, 9, 3. f. Use p-Value to test the null hypothesis that the mean of the population is 6 against the alternative hypothesis, ? ≠6. Use ? = .05.arrow_forwardThe mean age of De Anza College students in a previous term was 26.6 years old. An instructor thinks the mean age for online students is older than 26.6. She randomly surveys 59 online students and finds that the sample mean is 29.5 with a standard deviation of 2.1. Conduct a hypothesis test at the 5% level.Note: If you are using a Student's t-distribution for the problem, you may assume that the underlying population is normally distributed. (In general, you must first prove that assumption, though.) a) State the distribution to use for the test. b)What is the test statistic? (If using the z distribution round your answers to two decimal places, and if using the t distribution round your answers to three decimal places.) c) Construct a 95% confidence interval for the true mean. Sketch the graph of the situation. Label the point estimate and the lower and upper bounds of the confidence interval. (Round your answers to two decimal places.)arrow_forwardIs memory ability before a meal the same as after a meal? Ten people were given memory tests before their meal and then again after their meal. The data is shown below. A higher score indicates a better memory ability. Ho: Select an answer H₁: Select an answer ✓ Before a Meal After a Meal Assume a Normal distribution. What can be concluded at the the a = 0.01 level of significance? For this study, we should use Select an answer a. The null and alternative hypotheses would be: b. The test statistic ? ✓ = Score on the Memory Test 67 44 71 77 63 76 53 50 71 82 76 54 71 86 75 88 58 49 89 83 Select an answer Select an answer V c. The p-value d. The p-value is ? ✓ a e. Based on this, we should f. Thus, the final conclusion is that ... Select an answer Select an answer (please enter a decimal) (Please enter a decimal) (please show your answer to 3 decimal places.) (Please show your answer to 4 decimal places.) Select an answer the null hypothesis.arrow_forward
- Given in the table are the BMI statistics for random samples of men and women. Assume that the two samples are independent simple random samples selected from normally distributed populations, and do not assume that the population standard deviations are equal. Complete parts (a) and (b) below. Use a 0.01 significance level for both parts. a. Test the claim that males and females have the same mean body mass index (BMI). What are the null and alternative hypotheses? OA. Ho: H=H H₁: Hy > H₂ ỌC. Ho: H=H2 H₁: H₁ H₂ The test statistic, t, is. (Round to two decimal places as needed.) The P-value is (Round to three decimal places as needed.) State the conclusion for the test. -C OB. Ho: ₁2/₂ H₁ H₁ H₂ OD. Ho. Hy#t H₁: H₁ H₂ O A. Fail to reject the null hypothesis. There is sufficient evidence to warrant rejection of the claim that men and women have the same mean BMI. O B. Fail to reject the null hypothesis. There is not sufficient evidence to warrant rejection of the claim that men and women…arrow_forwardDo men score the same on average compared to women on their statistics finals? Final exam scores of eleven randomly selected male statistics students and eleven randomly selected female statistics students are shown below. Male: 59 85 89 66 70 92 75 91 61 65 58 Female: 54 49 81 63 75 58 59 55 75 74 70 Assume both follow a Normal distribution. What can be concluded at the the αα = 0.05 level of significance level of significance? For this study, we should use Select an answer t-test for the difference between two independent population means t-test for the difference between two dependent population means t-test for a population mean z-test for the difference between two population proportions z-test for a population proportion The null and alternative hypotheses would be: H0:H0: Select an answer p1 μ1 Select an answer < = ≠ > Select an answer p2 μ2 (please enter a decimal) H1:H1:…arrow_forwardWhich of the following is not a requirement for one-way ANOVA? ... A. The populations are approximately normally distributed B. The samples are independent of each other C. The populations have the same variance D. none of the other answers E. The populations have the same mean O F. The sample sizes from each population are the samearrow_forward
- A sample of scores has a mean of M = 20, a median of 28, and a mode of 29. What is the most likely shape for the sample distribution? symmetrical positively skewed negatively skewed cannot be determined from the information givenarrow_forwardRed Blood Cell Count: A simple random sample of 300 adult males is taken to measure the red blood cell count (in cells per microliter). Use a significance level of 0.01 to test the claim that the sample has a mean less than the population mean (μ = 5.4 million cells per microliter). Does the sample have a normal distribution? Explain why. Does the result suggest that the male sample has a red blood cell count below 5.4 million cells per microliter? Determine the descriptive statistics of the sample. State the statistical hypotheses: H0 and HA. Determine the α Is this test one or two tailed? What statistical conclusion did you reach regarding the question being evaluated? RED 4.80 4.73 4.47 4.32 4.95 3.95 4.68 4.60 4.09 5.47 4.44 4.15 5.07 4.38 5.22 4.22 4.32 4.30 6.34 5.60 4.93 5.18 3.54 4.61 4.22 4.99 5.23 4.01 4.07 5.06 4.30 4.28 4.76 4.14 4.61 4.67 4.36 4.28 4.59 4.77 3.86 5.38 5.03 4.60…arrow_forwardA survey conducted between February 25 and March 10, 2002, asked a random sample of n = 2,105 adult Americans, "Do you favor or oppose scientific experimentation on the cloning of human beings?" The responses and the percentages of adults that selected them were as follows: Favor (13%), Oppose (72%), Don't know or Refused to answer (15%). (a) What is the approximate margin of error (as a proportion) for this survey? (Round your answer to three decimal places.) (b) Find approximate 95% confidence intervals for the proportion and the percentage of adult Americans who would say they favor this experimentation. (Round your proportions to three decimal places and your percentages to one decimal place.) proportion _ , _ percentage _ , _ %arrow_forward
- Given in the table are the BMI statistics for random samples of men and women. Assume that the two samples are independent simple random samples selected from normally distributed populations, and do not assume that the population standard deviations are equal. Complete parts (a) and (b) below. Use a 0.01 significance level for both parts. a. Test the claim that males and females have the same mean body mass index (BMI). What are the null and alternative hypotheses? OA. Ho: H₁ H₂ H₁: H₁ H₂ OC. Ho: H₁ H₂ H₁ H₁ H₂ The test statistic, t, is The P-value is (Round to two decimal places as needed.) (Round to three decimal places as needed.) State the conclusion for the test. C O B. Ho: H=H2 H₁: H₁ H₂ OD. Ho Hy#t H₁: H₁ H₂ O A. Reject the null hypothesis. There is not sufficient evidence to warrant rejection of the claim that men and women have the same mean BMI. O B. Fail to reject the null hypothesis. There is sufficient evidence to warrant rejection of the claim that men and women have the…arrow_forwardIf, in a sample of n=20 selected from a normal population, X=53 and S=8, what are the critical values of t if the level of significance, α, is 0.01, the null hypothesis, H0, is μ=50, and the alternative hypothesis, H1, is μ≠50? Click here to view page 1 of the critical values for the t Distribution. LOADING... Click here to view page 2 of the critical values for the t Distribution. LOADING... Question content area bottom Part 1 The critical values of t are enter your response here.arrow_forwardDo men score lower on average compared to women on their statistics finals? Final exam scores of eleven randomly selected male statistics students and ten randomly selected female statistics students are shown below. Male: 77 76 91 77 56 83 77 71 65 59 66 Female: 84 99 75 87 89 68 85 99 80 80 Assume both follow a Normal distribution. What can be concluded at the the αα = 0.10 level of significance level of significance? For this study, we should use Select an answer z-test for a population proportion z-test for the difference between two population proportions t-test for the difference between two independent population means t-test for a population mean t-test for the difference between two dependent population means The null and alternative hypotheses would be: H0:H0: Select an answer μ1 p1 Select an answer ≠ = < > Select an answer p2 μ2 (please enter a decimal) H1:H1: Select an…arrow_forward
arrow_back_ios
SEE MORE QUESTIONS
arrow_forward_ios
Recommended textbooks for you
- MATLAB: An Introduction with ApplicationsStatisticsISBN:9781119256830Author:Amos GilatPublisher:John Wiley & Sons Inc
 Probability and Statistics for Engineering and th...StatisticsISBN:9781305251809Author:Jay L. DevorePublisher:Cengage Learning
 Statistics for The Behavioral Sciences (MindTap C...StatisticsISBN:9781305504912Author:Frederick J Gravetter, Larry B. WallnauPublisher:Cengage Learning
  Elementary Statistics: Picturing the World (7th E...StatisticsISBN:9780134683416Author:Ron Larson, Betsy FarberPublisher:PEARSON
 The Basic Practice of StatisticsStatisticsISBN:9781319042578Author:David S. Moore, William I. Notz, Michael A. FlignerPublisher:W. H. Freeman
 Introduction to the Practice of StatisticsStatisticsISBN:9781319013387Author:David S. Moore, George P. McCabe, Bruce A. CraigPublisher:W. H. Freeman
MATLAB: An Introduction with Applications
Statistics
ISBN:9781119256830
Author:Amos Gilat
Publisher:John Wiley & Sons Inc
Probability and Statistics for Engineering and th...
Statistics
ISBN:9781305251809
Author:Jay L. Devore
Publisher:Cengage Learning
Statistics for The Behavioral Sciences (MindTap C...
Statistics
ISBN:9781305504912
Author:Frederick J Gravetter, Larry B. Wallnau
Publisher:Cengage Learning
Elementary Statistics: Picturing the World (7th E...
Statistics
ISBN:9780134683416
Author:Ron Larson, Betsy Farber
Publisher:PEARSON
The Basic Practice of Statistics
Statistics
ISBN:9781319042578
Author:David S. Moore, William I. Notz, Michael A. Fligner
Publisher:W. H. Freeman
Introduction to the Practice of Statistics
Statistics
ISBN:9781319013387
Author:David S. Moore, George P. McCabe, Bruce A. Craig
Publisher:W. H. Freeman