
MATLAB: An Introduction with Applications
6th Edition
ISBN: 9781119256830
Author: Amos Gilat
Publisher: John Wiley & Sons Inc
expand_more
expand_more
format_list_bulleted
Related questions
Question
[3] Instructions: Read each excerpt from a research paper and identify the dependent, independent, controlled variable (at least 1), experimental group/treatment, and control group.
| Independent variable: | |
| Dependent variable: | |
| Controlled variable: | |
| Experimental Group: | |
| Control group: |
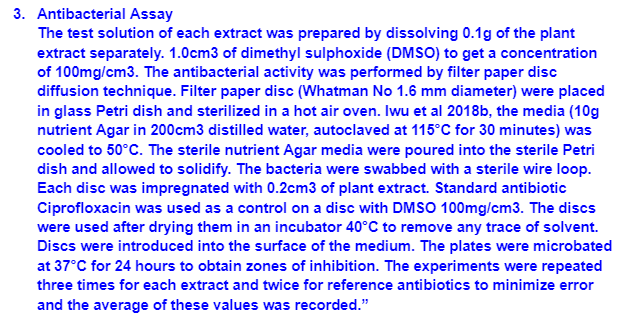

Transcribed Image Text:3. Antibacterial Assay
The test solution of each extract was prepared by dissolving 0.1g of the plant
extract separately. 1.0cm3 of dimethyl sulphoxide (DMSO) to get a concentration
of 100mg/cm3. The antibacterial activity was performed by filter paper disc
diffusion technique. Filter paper disc (Whatman No 1.6 mm diameter) were placed
in glass Petri dish and sterilized in a hot air oven. Iwu et al 2018b, the media (10g
nutrient Agar in 200cm3 distilled water, autoclaved at 115°C for 30 minutes) was
cooled to 50°C. The sterile nutrient Agar media were poured into the sterile Petri
dish and allowed to solidify. The bacteria were swabbed with a sterile wire loop.
Each disc was impregnated with 0.2cm3 of plant extract. Standard antibiotic
Ciprofloxacin was used as a control on a disc with DMSO 100mg/cm3. The discs
were used after drying them in an incubator 40°C to remove any trace of solvent.
Discs were introduced into the surface of the medium. The plates were microbated
at 37°C for 24 hours to obtain zones of inhibition. The experiments were repeated
three times for each extract and twice for reference antibiotics to minimize error
and the average of these values was recorded."
Expert Solution
This question has been solved!
Explore an expertly crafted, step-by-step solution for a thorough understanding of key concepts.

Step by stepSolved in 3 steps

Knowledge Booster

Similar questions
- Categorize each of the following variables from the attached Excel SAMPLE data file as Quantitative (Discrete or Continuous) or Qualitative (Nominal or Ordinal). Place an X in the correct cell of the following table. A variable can ONLY be Quantitative OR Qualitative NOT both. Variable Quantitative Qualitative Discrete Continuous Nominal Ordinal Male Height Male Weight Female Height Female Weight Birth Country Education Level Female Pulse Male Pulsearrow_forwardWhich of the following are the names commonly used for the variable Y in sample regression? 1. covariate variable 2. independent variable 3. predictor variable 4. Explained variable 5. Response variable 6. explanatory variable 7. Predicted variable 8. Dependent variable 9. Criterion variablearrow_forwardSystematic variability occurs when: A. there are too many control variables B. there is a lot of variability in the data C. there is a design confound D. there are too many dependent variablearrow_forward
- A sample of 548 ethnically diverse students from Massachusetts were followed over a 19-month period from 1995 and 1997 in a study of the relationship between TV viewing and eating habits. For each additional hour of television viewed per day, the number of fruit and vegetable servings per day was found to decrease on average by 0.14 serving. (a) For this study, what is the dependent variable? O location of students O number of fruit and vegetable servings per day O number of non fruit or vegetable servings per day O number of hours of television viewed per day year What is the independent variable? O location of students O number of fruit and vegetable servings per day O number of non fruit or vegetable servings per day O number of hours of television viewed per day O year (b) Would the least-squares line for predicting number of servings of fruits and vegetables using number of hours spent watching TV as a predictor have a positive or negative slope? Explain. O The slope of the least…arrow_forwardA science project involves testing the effects of different types of music on plant growth. A sample of 24 newly sprouted bean plants is obtained. The plants are randomly assigned to each experimental condition (6 per group). The experimental conditions are: rock music, heavy metal, country, and classical. The dependent variable is the height of each plant after 2 weeks. The ANOVA results are summarized as follows: MSB = 10 and SSW =40. Construct a summary table for this studyarrow_forwardIn a certain study, the effect on oat yield was compared for the Pallinup, Overberg and Magnifico varieties of oats and four different concentrations of manure (0, 0.2, 0.4 and 0.6 tonnes per acre). Identify the experimental units, response variable, factor(s), levels of each factor and treatments.arrow_forward
- 2. A researcher had rats engage in a lever-press task for either a small, medium, or larger reward. The number of lever presses was the dependent variable. The data were as follows: Reward Size Small Medium Large 1 4 6 4 3 5 1 4 4 2 5 T = 13 SS = 2.75 T= 6 T= 20 SS = 9 SS = 2 EX2 = 165 a. Do the data indicate that reward size had a significant impact on lever-pressing? Use the hypothesis testing steps & p = .05. Compute any necessary post-hoc tests. b. Compute eta-squared to measure the effect size.arrow_forwardA team of epidemiologists at the Mayo Clinic wanted to find whether there is an association between obesity and cardiovascular disease (CVD). They conducted a prospective cohort study following obese and non-obese individuals who were free of CVD at the beginning of study for five years. The investigators were also interested in assessing age as a potential confounder, effect modifier, or both. Use the data below to answer the accompanying questions. CVD No CVD Total Obese 10 90 100 Not Obese 35 465 500 Total 45 555 600 CVD No CVD Total Obese 36 164 200 Not Obese 25 175 200 Total 61 339 400 1. Compute the appropriate measure of association for those who were less than age 50. 2. Compute the appropriate measure of association for those who were older or equal to age 50. 3. Compute the crude measure of association? 4. List three attributes that age must satisfy before it could…arrow_forward
arrow_back_ios
arrow_forward_ios
Recommended textbooks for you
- MATLAB: An Introduction with ApplicationsStatisticsISBN:9781119256830Author:Amos GilatPublisher:John Wiley & Sons Inc
 Probability and Statistics for Engineering and th...StatisticsISBN:9781305251809Author:Jay L. DevorePublisher:Cengage Learning
 Statistics for The Behavioral Sciences (MindTap C...StatisticsISBN:9781305504912Author:Frederick J Gravetter, Larry B. WallnauPublisher:Cengage Learning
  Elementary Statistics: Picturing the World (7th E...StatisticsISBN:9780134683416Author:Ron Larson, Betsy FarberPublisher:PEARSON
 The Basic Practice of StatisticsStatisticsISBN:9781319042578Author:David S. Moore, William I. Notz, Michael A. FlignerPublisher:W. H. Freeman
 Introduction to the Practice of StatisticsStatisticsISBN:9781319013387Author:David S. Moore, George P. McCabe, Bruce A. CraigPublisher:W. H. Freeman
MATLAB: An Introduction with Applications
Statistics
ISBN:9781119256830
Author:Amos Gilat
Publisher:John Wiley & Sons Inc
Probability and Statistics for Engineering and th...
Statistics
ISBN:9781305251809
Author:Jay L. Devore
Publisher:Cengage Learning
Statistics for The Behavioral Sciences (MindTap C...
Statistics
ISBN:9781305504912
Author:Frederick J Gravetter, Larry B. Wallnau
Publisher:Cengage Learning
Elementary Statistics: Picturing the World (7th E...
Statistics
ISBN:9780134683416
Author:Ron Larson, Betsy Farber
Publisher:PEARSON
The Basic Practice of Statistics
Statistics
ISBN:9781319042578
Author:David S. Moore, William I. Notz, Michael A. Fligner
Publisher:W. H. Freeman
Introduction to the Practice of Statistics
Statistics
ISBN:9781319013387
Author:David S. Moore, George P. McCabe, Bruce A. Craig
Publisher:W. H. Freeman