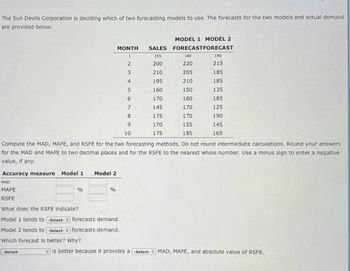
The Sun Devils Corporation is deciding which of two forecasting models to use. The forecasts for the two models and actual demand are provided below: MAD MAPE RSFE What does the RSFE indicate? Model 1 tends to -Select- Model 2 tends to -Select- Which forecast is better? Why? -Select- % Compute the MAD, MAPE, and RSFE for the two forecasting methods. Do not round intermediate calculations. Round your answers for the MAD and MAPE to two decimal places and for the RSFE to the nearest whole number. Use a minus sign to enter a negative value, if any. Accuracy measure Model 1 Model 2 MODEL 1 MODEL 2 MONTH SALES FORECASTFORECAST 1 155 2 200 3 210 4 195 5 160 6 170 7 145 8 175 9 170 10 175 % 140 220 205 210 150 160 170 170 forecasts demand. forecasts demand. 155 185 180 215 185 185 135 185 125 190 145 165 is better because it provides a -Select- MAD, MAPE, and absolute value of RSFE.
The Sun Devils Corporation is deciding which of two forecasting models to use. The forecasts for the two models and actual demand are provided below: MAD MAPE RSFE What does the RSFE indicate? Model 1 tends to -Select- Model 2 tends to -Select- Which forecast is better? Why? -Select- % Compute the MAD, MAPE, and RSFE for the two forecasting methods. Do not round intermediate calculations. Round your answers for the MAD and MAPE to two decimal places and for the RSFE to the nearest whole number. Use a minus sign to enter a negative value, if any. Accuracy measure Model 1 Model 2 MODEL 1 MODEL 2 MONTH SALES FORECASTFORECAST 1 155 2 200 3 210 4 195 5 160 6 170 7 145 8 175 9 170 10 175 % 140 220 205 210 150 160 170 170 forecasts demand. forecasts demand. 155 185 180 215 185 185 135 185 125 190 145 165 is better because it provides a -Select- MAD, MAPE, and absolute value of RSFE.
Oh no! Our experts couldn't answer your question.
Don't worry! We won't leave you hanging. Plus, we're giving you back one question for the inconvenience.
Submit your question and receive a step-by-step explanation from our experts in as fast as 30 minutes.
You have no more questions left.
Message from our expert:
Our experts are unable to provide you with a solution at this time. Try rewording your question, and make sure to submit one question at a time. A question credit has been added to your account for future use.
Your Question:

Transcribed Image Text:The Sun Devils Corporation is deciding which of two forecasting models to use. The forecasts for the two models and actual demand
are provided below:
MAD
MAPE
RSFE
What does the RSFE indicate?
Model 1 tends to -Select-
Model 2 tends to -Select-
Which forecast is better? Why?
-Select-
%
Compute the MAD, MAPE, and RSFE for the two forecasting methods. Do not round intermediate calculations. Round your answers
for the MAD and MAPE to two decimal places and for the RSFE to the nearest whole number. Use a minus sign to enter a negative
value, if any.
Accuracy measure Model 1
Model 2
MODEL 1 MODEL 2
MONTH SALES FORECASTFORECAST
1
155
2
200
3
210
4
195
5
160
6
170
7
145
8
175
9
170
10
175
%
140
220
205
210
150
160
170
170
forecasts demand.
forecasts demand.
155
185
180
215
185
185
135
185
125
190
145
165
is better because it provides a -Select- MAD, MAPE, and absolute value of RSFE.
Recommended textbooks for you

Essentials of Business Analytics (MindTap Course …
Statistics
ISBN:
9781305627734
Author:
Jeffrey D. Camm, James J. Cochran, Michael J. Fry, Jeffrey W. Ohlmann, David R. Anderson
Publisher:
Cengage Learning

Essentials Of Business Analytics
Statistics
ISBN:
9781285187273
Author:
Camm, Jeff.
Publisher:
Cengage Learning,

Principles of Cost Accounting
Accounting
ISBN:
9781305087408
Author:
Edward J. Vanderbeck, Maria R. Mitchell
Publisher:
Cengage Learning

Essentials of Business Analytics (MindTap Course …
Statistics
ISBN:
9781305627734
Author:
Jeffrey D. Camm, James J. Cochran, Michael J. Fry, Jeffrey W. Ohlmann, David R. Anderson
Publisher:
Cengage Learning

Essentials Of Business Analytics
Statistics
ISBN:
9781285187273
Author:
Camm, Jeff.
Publisher:
Cengage Learning,

Principles of Cost Accounting
Accounting
ISBN:
9781305087408
Author:
Edward J. Vanderbeck, Maria R. Mitchell
Publisher:
Cengage Learning

Financial Reporting, Financial Statement Analysis…
Finance
ISBN:
9781285190907
Author:
James M. Wahlen, Stephen P. Baginski, Mark Bradshaw
Publisher:
Cengage Learning
