
MATLAB: An Introduction with Applications
6th Edition
ISBN: 9781119256830
Author: Amos Gilat
Publisher: John Wiley & Sons Inc
expand_more
expand_more
format_list_bulleted
Related questions
Concept explainers
Topic Video
Question
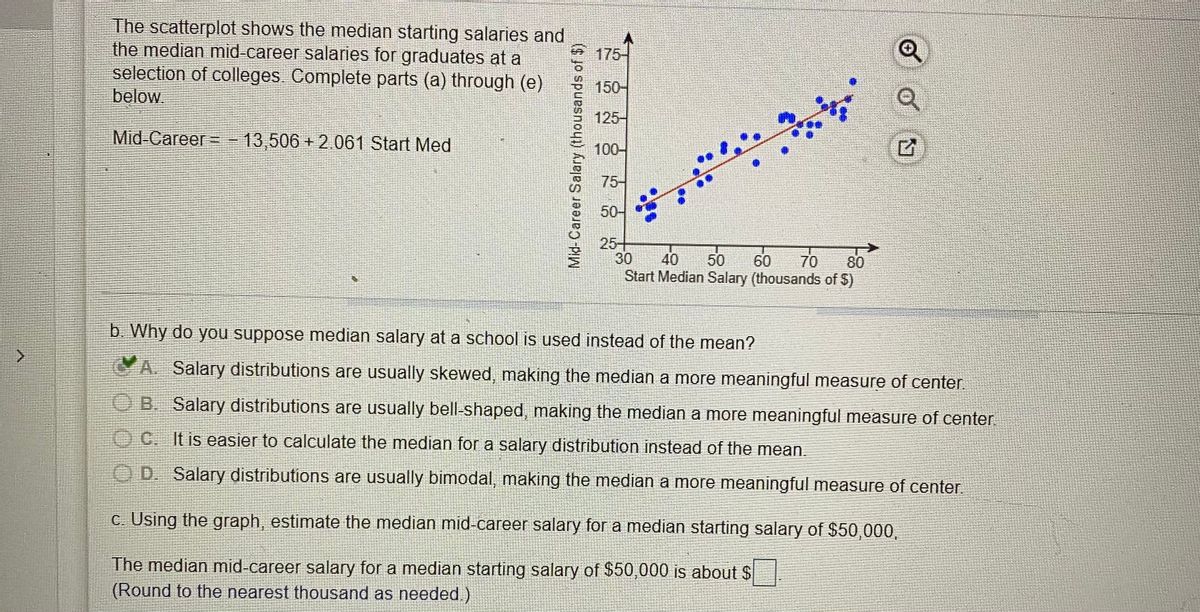

Transcribed Image Text:The scatterplot shows the median starting salaries and
the median mid-career salaries for graduates at a
selection of colleges Complete parts (a) through (e)
below
175-
150-
125-
Mid-Career--
13,506 + 2.061 Start Med
100-
75-
50-
25+
30
Start Median Salary (thousands of $)
40
50
60
70
80
b. Why do you suppose median salary at a school is used instead of the mean?
A. Salary distributions are usually skewed, making the median a more meaningful measure of center
QB. Salary distributions are usually bell-shaped, making the median a more meaningful measure of center
OC. It is easier to calculate the median for a salary distribution instead of the mean.
OD. Salary distributions are usually bimodal, making the median a more meaningful measure of center.
c. Using the graph, estimate the median mid-career salary for a median starting salary of $50,000,
The median mid-career salary for a median starting salary of $50,000 is about $
(Round to the nearest thousand as needed.)
Mid-Career Salary (thousands of $)
Expert Solution
This question has been solved!
Explore an expertly crafted, step-by-step solution for a thorough understanding of key concepts.

This is a popular solution

Trending nowThis is a popular solution!

Step by stepSolved in 2 steps

Knowledge Booster


Learn more about
Need a deep-dive on the concept behind this application? Look no further. Learn more about this topic, statistics and related others by exploring similar questions and additional content below.Similar questions
- What length of time marks the top 10% of all pregnancies?arrow_forwardHow do you set up a percentage histogram and percentage polygon in Excel with a data set?arrow_forwardAccording to an organization, there are five leading causes of preventable death in a region. They are shown in the graph to the right, where HBP is High Blood Pressure, TU is Tobacco Use, HBG is High Blood Glucose, PA is Physical Activity, and 00 and Overweight and Obesity. Use the graph to complete parts (a) Millions in One Year ळतळजवलतत्व HBP TU a. Estimate how many preventable deaths result from high blood pressure. Approximately million preventable deaths in one year result from high blood pressure. (Round to one decimal place as needed.) HBG Li PA 00arrow_forward
arrow_back_ios
arrow_forward_ios
Recommended textbooks for you
- MATLAB: An Introduction with ApplicationsStatisticsISBN:9781119256830Author:Amos GilatPublisher:John Wiley & Sons Inc
 Probability and Statistics for Engineering and th...StatisticsISBN:9781305251809Author:Jay L. DevorePublisher:Cengage Learning
 Statistics for The Behavioral Sciences (MindTap C...StatisticsISBN:9781305504912Author:Frederick J Gravetter, Larry B. WallnauPublisher:Cengage Learning
  Elementary Statistics: Picturing the World (7th E...StatisticsISBN:9780134683416Author:Ron Larson, Betsy FarberPublisher:PEARSON
 The Basic Practice of StatisticsStatisticsISBN:9781319042578Author:David S. Moore, William I. Notz, Michael A. FlignerPublisher:W. H. Freeman
 Introduction to the Practice of StatisticsStatisticsISBN:9781319013387Author:David S. Moore, George P. McCabe, Bruce A. CraigPublisher:W. H. Freeman
MATLAB: An Introduction with Applications
Statistics
ISBN:9781119256830
Author:Amos Gilat
Publisher:John Wiley & Sons Inc
Probability and Statistics for Engineering and th...
Statistics
ISBN:9781305251809
Author:Jay L. Devore
Publisher:Cengage Learning
Statistics for The Behavioral Sciences (MindTap C...
Statistics
ISBN:9781305504912
Author:Frederick J Gravetter, Larry B. Wallnau
Publisher:Cengage Learning
Elementary Statistics: Picturing the World (7th E...
Statistics
ISBN:9780134683416
Author:Ron Larson, Betsy Farber
Publisher:PEARSON
The Basic Practice of Statistics
Statistics
ISBN:9781319042578
Author:David S. Moore, William I. Notz, Michael A. Fligner
Publisher:W. H. Freeman
Introduction to the Practice of Statistics
Statistics
ISBN:9781319013387
Author:David S. Moore, George P. McCabe, Bruce A. Craig
Publisher:W. H. Freeman