Exploring Economics
8th Edition
ISBN: 9781544336329
Author: Robert L. Sexton
Publisher: SAGE Publications, Inc
expand_more
expand_more
format_list_bulleted
Question

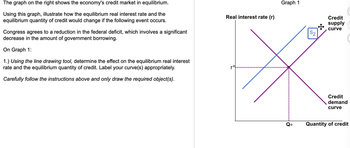
Transcribed Image Text:The graph on the right shows the economy's credit market in equilibrium.
Using this graph, illustrate how the equilibrium real interest rate and the
equilibrium quantity of credit would change if the following event occurs.
Congress agrees to a reduction in the federal deficit, which involves a significant
decrease in the amount of government borrowing.
On Graph 1:
1.) Using the line drawing tool, determine the effect on the equilibrium real interest
rate and the equilibrium quantity of credit. Label your curve(s) appropriately.
Carefully follow the instructions above and only draw the required object(s).
Real interest rate (r)
r²
Graph 1
Q*
S2
Credit
supply
curve
Credit
demand
curve
Quantity of credit

Transcribed Image Text:D. Households expect an economic downturn ahead.
Japan has been observing a demographic trend of rapid aging. More and more
households are approaching the age of retirement which is affecting their saving
rate, which in turn is affecting the credit supply in the economy. Suppose the
Japanese government now decides to increase taxes on profits. This affects the
credit demand in the economy.
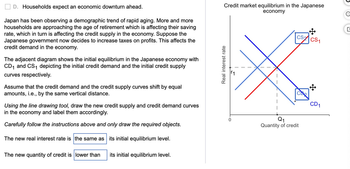
The adjacent diagram shows the initial equilibrium in the Japanese economy with
CD₁ and CS₁ depicting the initial credit demand and the initial credit supply
curves respectively.
Assume that the credit demand and the credit supply curves shift by equal
amounts, i.e., by the same vertical distance.
Using the line drawing tool, draw the new credit supply and credit demand curves
in the economy and label them accordingly.
Carefully follow the instructions above and only draw the required objects.
The new real interest rate is the same as
The new quantity of credit is lower than
its initial equilibrium level.
its initial equilibrium level.
Credit market equilibrium in the Japanese
economy
Real interest rate
0
CS2
CD₂
Q1
Quantity of credit
CS1
CD1
e
Expert Solution
This question has been solved!
Explore an expertly crafted, step-by-step solution for a thorough understanding of key concepts.
This is a popular solution
Trending nowThis is a popular solution!
Step by stepSolved in 2 steps with 1 images

Knowledge Booster
Learn more about
Need a deep-dive on the concept behind this application? Look no further. Learn more about this topic, economics and related others by exploring similar questions and additional content below.Similar questions
- Suppose the economy is operating at potential GDP when It experiences an increase in export demand. How might the economy increase production of exports to meet this demand, given that the economy is already at full employment?arrow_forwardAssume there is no discretionary increase in government spending. Explain how an improving economy will affect the budget balance and, in turn, investment and the trade balance.arrow_forwardUnder what condition would crowding out not inhibit long-run economic growth? Under what condition would crowding out impede long-run economic growth?arrow_forward
- What is says law?arrow_forwardEconomist Arthur Laffer famously pointed out that, in some cases, income tax revenue can actually go up when tax rates go down. Why might this be the case?arrow_forwardExercise D24 Compare two policies: a tax cut on income or an increase in government spending on roads and bridges. What are both the short-term and long—term impacts of such policies on the economy?arrow_forward
arrow_back_ios
arrow_forward_ios
Recommended textbooks for you
 Exploring EconomicsEconomicsISBN:9781544336329Author:Robert L. SextonPublisher:SAGE Publications, Inc
 Principles of Economics (MindTap Course List)EconomicsISBN:9781305585126Author:N. Gregory MankiwPublisher:Cengage Learning
 Principles of Macroeconomics (MindTap Course List)EconomicsISBN:9781285165912Author:N. Gregory MankiwPublisher:Cengage Learning
 Brief Principles of Macroeconomics (MindTap Cours...EconomicsISBN:9781337091985Author:N. Gregory MankiwPublisher:Cengage Learning
 Principles of Economics, 7th Edition (MindTap Cou...EconomicsISBN:9781285165875Author:N. Gregory MankiwPublisher:Cengage Learning
 Principles of Macroeconomics (MindTap Course List)EconomicsISBN:9781305971509Author:N. Gregory MankiwPublisher:Cengage Learning

Exploring Economics
Economics
ISBN:9781544336329
Author:Robert L. Sexton
Publisher:SAGE Publications, Inc

Principles of Economics (MindTap Course List)
Economics
ISBN:9781305585126
Author:N. Gregory Mankiw
Publisher:Cengage Learning

Principles of Macroeconomics (MindTap Course List)
Economics
ISBN:9781285165912
Author:N. Gregory Mankiw
Publisher:Cengage Learning

Brief Principles of Macroeconomics (MindTap Cours...
Economics
ISBN:9781337091985
Author:N. Gregory Mankiw
Publisher:Cengage Learning

Principles of Economics, 7th Edition (MindTap Cou...
Economics
ISBN:9781285165875
Author:N. Gregory Mankiw
Publisher:Cengage Learning

Principles of Macroeconomics (MindTap Course List)
Economics
ISBN:9781305971509
Author:N. Gregory Mankiw
Publisher:Cengage Learning