
MATLAB: An Introduction with Applications
6th Edition
ISBN: 9781119256830
Author: Amos Gilat
Publisher: John Wiley & Sons Inc
expand_more
expand_more
format_list_bulleted
Related questions
Question
thumb_up100%
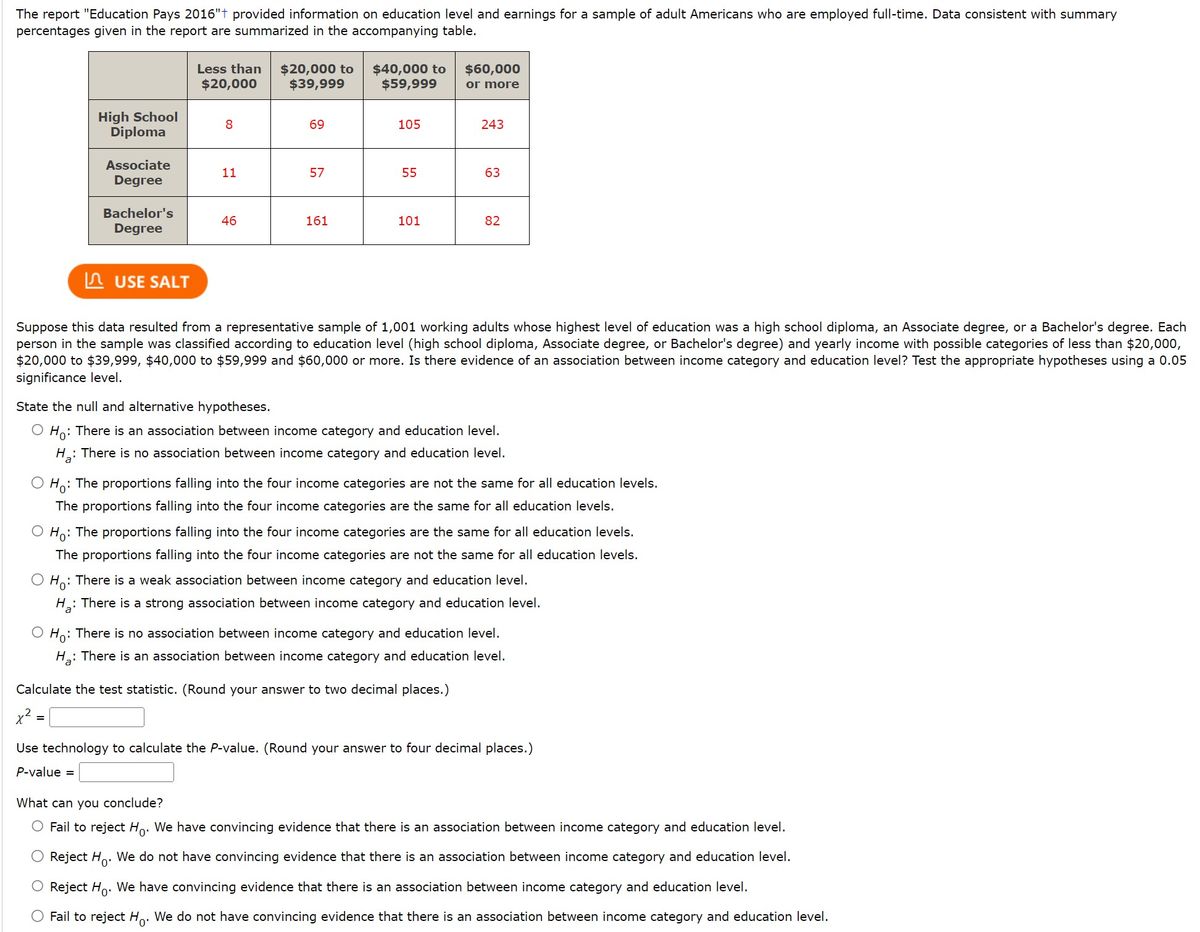

Transcribed Image Text:The report "Education Pays 2016"t provided information on education level and earnings for a sample of adult Americans who are employed full-time. Data consistent with summary
percentages given in the report are summarized in the accompanying table.
High School
Diploma
Associate
Degree
Bachelor's
Degree
USE SALT
Less than $20,000 to $40,000 to
$20,000 $39,999
$59,999
,2
8
11
46
69
57
161
105
55
101
$60,000
or more
243
63
82
Suppose this data resulted from a representative sample of 1,001 working adults whose highest level of education was a high school diploma, an Associate degree, or a Bachelor's degree. Each
person in the sample was classified according to education level (high school diploma, Associate degree, or Bachelor's degree) and yearly income with possible categories of less than $20,000,
$20,000 to $39,999, $40,000 to $59,999 and $60,000 or more. Is there evidence of an association between income category and education level? Test the appropriate hypotheses using a 0.05
significance level.
State the null and alternative hypotheses.
O Ho: There is an association between income category and education level.
H: There is no association between income category and education level.
оно
The proportions falling into the four income categories are not the same for all education levels.
The proportions falling into the four income categories are the same for all education levels.
O Ho: The proportions falling into the four income categories are the same for all education levels.
The proportions falling into the four income categories are not the same for all education levels.
O Ho: There is a weak association between income category and education level.
H₂: There is a strong association between income category and education level.
O Ho: There is no association between income category and education level.
H₂: There is an association between income category and education level.
Calculate the test statistic. (Round your answer to two decimal places.)
Use technology to calculate the P-value. (Round your answer to four decimal places.)
P-value =
What can you conclude?
O Fail to reject Ho. We have convincing evidence that there is an association between income category and education level.
O Reject Ho. We do not have convincing evidence that there is an association between income category and education level.
O Reject Ho. We have convincing evidence that there is an association between income category and education level.
Fail to reject Ho. We do not have convincing evidence that there is an association between income category and education level.
Expert Solution
This question has been solved!
Explore an expertly crafted, step-by-step solution for a thorough understanding of key concepts.

This is a popular solution

Trending nowThis is a popular solution!

Step by stepSolved in 5 steps with 1 images

Knowledge Booster

Similar questions
- DATAfile: Houston You may need to use the appropriate appendix table or technology to answer this question. Data were collected on the amount spent by 64 customers for lunch at a major Houston restaurant. These data are contained in the file Houston. Fill in the missing numbers in the measures of spread below: 20.50 14.63 23.77 29.96 29.49 32.70 9.20 20.89 28.87 15.78 18.16 12.16 11.22 16.43 17.66 9.59 18.89 19.88 23.11 20.11 20.34 20.08 30.36 21.79 21.18 19.22 34.13 27.49 36.55 18.37 32.27 12.63 25.53 27.71 33.81 21.79 19.16 26.35 20.01 26.85 13.63 17.22 13.17 20.12 22.11 22.47 20.36 35.47 11.85 17.88 6.83 30.99 14.62 18.38 26.85 25.10 27.55 25.87 14.37 15.61 26.46 24.24 16.66 20.85 (a) On average, the amounts spent are $ from the mean amount spent. (Round your answer to two decimals) (b) There is a $ difference in the highest and lowest amounts spent. (Round your answers to two decimals.) (c) The standard deviation is % of the mean amount spent. (Round your answers to two decimals.)…arrow_forwardwhat is the mean of the data set?arrow_forwardConsider the data set given in the accompanying table. Y total A 7 3. 4 1 8. total 8 6. 1 15 What is the total population size? O 15 O 48 O 7 O 8arrow_forward
arrow_back_ios
arrow_forward_ios
Recommended textbooks for you
- MATLAB: An Introduction with ApplicationsStatisticsISBN:9781119256830Author:Amos GilatPublisher:John Wiley & Sons Inc
 Probability and Statistics for Engineering and th...StatisticsISBN:9781305251809Author:Jay L. DevorePublisher:Cengage Learning
 Statistics for The Behavioral Sciences (MindTap C...StatisticsISBN:9781305504912Author:Frederick J Gravetter, Larry B. WallnauPublisher:Cengage Learning
  Elementary Statistics: Picturing the World (7th E...StatisticsISBN:9780134683416Author:Ron Larson, Betsy FarberPublisher:PEARSON
 The Basic Practice of StatisticsStatisticsISBN:9781319042578Author:David S. Moore, William I. Notz, Michael A. FlignerPublisher:W. H. Freeman
 Introduction to the Practice of StatisticsStatisticsISBN:9781319013387Author:David S. Moore, George P. McCabe, Bruce A. CraigPublisher:W. H. Freeman
MATLAB: An Introduction with Applications
Statistics
ISBN:9781119256830
Author:Amos Gilat
Publisher:John Wiley & Sons Inc
Probability and Statistics for Engineering and th...
Statistics
ISBN:9781305251809
Author:Jay L. Devore
Publisher:Cengage Learning
Statistics for The Behavioral Sciences (MindTap C...
Statistics
ISBN:9781305504912
Author:Frederick J Gravetter, Larry B. Wallnau
Publisher:Cengage Learning
Elementary Statistics: Picturing the World (7th E...
Statistics
ISBN:9780134683416
Author:Ron Larson, Betsy Farber
Publisher:PEARSON
The Basic Practice of Statistics
Statistics
ISBN:9781319042578
Author:David S. Moore, William I. Notz, Michael A. Fligner
Publisher:W. H. Freeman
Introduction to the Practice of Statistics
Statistics
ISBN:9781319013387
Author:David S. Moore, George P. McCabe, Bruce A. Craig
Publisher:W. H. Freeman