
MATLAB: An Introduction with Applications
6th Edition
ISBN: 9781119256830
Author: Amos Gilat
Publisher: John Wiley & Sons Inc
expand_more
expand_more
format_list_bulleted
Related questions
Question
The random variable X has the following probability distribution.
Calculate the mean , variance, standard deviation, and expected value .
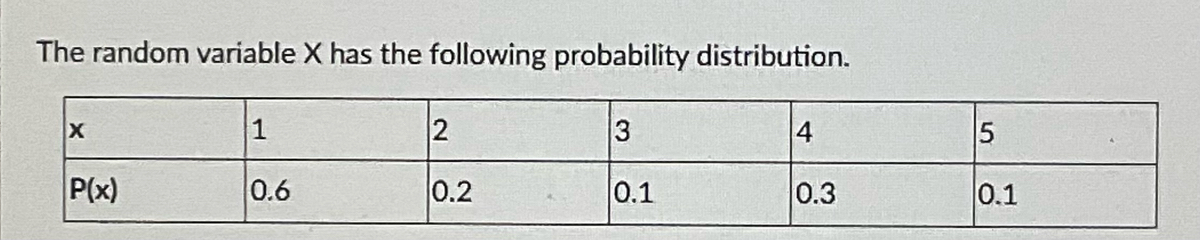

Transcribed Image Text:The random variable X has the following probability distribution.
1
2
3
4
P(x)
0.6
0.2
0.1
0.3
0.1
Expert Solution
This question has been solved!
Explore an expertly crafted, step-by-step solution for a thorough understanding of key concepts.

This is a popular solution

Trending nowThis is a popular solution!

Step by stepSolved in 5 steps

Knowledge Booster

Similar questions
- Solve the problem.Assume that mountain lions' weights are normally distributed with a mean of 62.6 kilograms and a standard deviation of 2.6 kilograms. If 70 mountain lions are randomly selected, find the probability that they have a mean weight between 61.9 kilograms and 62.8 pounds.arrow_forwardUse the probability distribution to complete parts (a) and (b) below. The number of defects per 1000 machine parts inspected Defects 1 2 4 Probability 0.264 0.290 0.240 0.148 0.042 0.016 ..... (a) Find the mean, variance, and standard deviation of the probability distribution.arrow_forwardA fair coin is flipped sixty times and the number of tails that occur is noted. A random variable X is defined as the number of tails. Find the expected value and the standard deviation. Expected value = nothing Variance = nothing Standard Deviation = nothingarrow_forward
- Find the mean, variance and standard deviation for the probability distribution given below: X -4 6 8 10 P(X) 0.57 0.111 0.21 0.109 A. Mean = B. Variance = C. Standard Deviation =arrow_forwardThe histogram shows the distribution of hurricanes that have hit a country from 1851 through 2015, where 1 is the weakest level and 5 is the strongest level. (a) Find the mean, variance, and standard deviation of the probability distribution. (b) Interpret the results. Hurricanes 123450.00.10.20.30.40.5CategoryProbability0.4070.2870.2260.0680.012 A histogram titled Hurricanes has a horizontal axis labeled Category from 1 to 5 in increments of 1 and a vertical axis labeled Probability from 0 to 0.5 in increments of 0.05. The histogram contains vertical bars of width 1, where one vertical bar is centered over each of the horizontal axis tick marks. The heights of the vertical bars are as follows, where the category is listed first and the height is listed second: 1, 0.407; 2, 0.287; 3, 0.226; 4, 0.068; 5, 0.012. Each bar is labeled with its height. (a) The mean is nothing. (Type an integer or a decimal. Do not…arrow_forwardUse the probability distribution to complete parts (a) and (b) below. The number of defects per 1000 machine parts inspected Defects 0 1 2 3 4 5 Probability 0.260 0.290 0.234 0.161 0.037 0.018 (a) Find the mean, variance, and standard deviation of the probability distribution.arrow_forward
- The number of needed repairs while under warranty for a Sure Cut lawnmower has a population distribution as shown in the probability histogram below. The population mean is also given. Population 0.6 - 0.5- 0.4- population mean: u=1.15 0.3- 0.2- Number of repairs Probabilityarrow_forwardFind the mean, variance and standard deviation for the probability distribution given below: X -5 2 12 10 P(X) 0.553 0.136 0.213 0.098arrow_forwardThe normal distribution curve can be used as a probability distribution curve for normally distributed variables. Group of answer choices False Truearrow_forward
arrow_back_ios
arrow_forward_ios
Recommended textbooks for you
- MATLAB: An Introduction with ApplicationsStatisticsISBN:9781119256830Author:Amos GilatPublisher:John Wiley & Sons Inc
 Probability and Statistics for Engineering and th...StatisticsISBN:9781305251809Author:Jay L. DevorePublisher:Cengage Learning
 Statistics for The Behavioral Sciences (MindTap C...StatisticsISBN:9781305504912Author:Frederick J Gravetter, Larry B. WallnauPublisher:Cengage Learning
  Elementary Statistics: Picturing the World (7th E...StatisticsISBN:9780134683416Author:Ron Larson, Betsy FarberPublisher:PEARSON
 The Basic Practice of StatisticsStatisticsISBN:9781319042578Author:David S. Moore, William I. Notz, Michael A. FlignerPublisher:W. H. Freeman
 Introduction to the Practice of StatisticsStatisticsISBN:9781319013387Author:David S. Moore, George P. McCabe, Bruce A. CraigPublisher:W. H. Freeman
MATLAB: An Introduction with Applications
Statistics
ISBN:9781119256830
Author:Amos Gilat
Publisher:John Wiley & Sons Inc
Probability and Statistics for Engineering and th...
Statistics
ISBN:9781305251809
Author:Jay L. Devore
Publisher:Cengage Learning
Statistics for The Behavioral Sciences (MindTap C...
Statistics
ISBN:9781305504912
Author:Frederick J Gravetter, Larry B. Wallnau
Publisher:Cengage Learning
Elementary Statistics: Picturing the World (7th E...
Statistics
ISBN:9780134683416
Author:Ron Larson, Betsy Farber
Publisher:PEARSON
The Basic Practice of Statistics
Statistics
ISBN:9781319042578
Author:David S. Moore, William I. Notz, Michael A. Fligner
Publisher:W. H. Freeman
Introduction to the Practice of Statistics
Statistics
ISBN:9781319013387
Author:David S. Moore, George P. McCabe, Bruce A. Craig
Publisher:W. H. Freeman