
MATLAB: An Introduction with Applications
6th Edition
ISBN: 9781119256830
Author: Amos Gilat
Publisher: John Wiley & Sons Inc
expand_more
expand_more
format_list_bulleted
Related questions
Concept explainers
Question
|
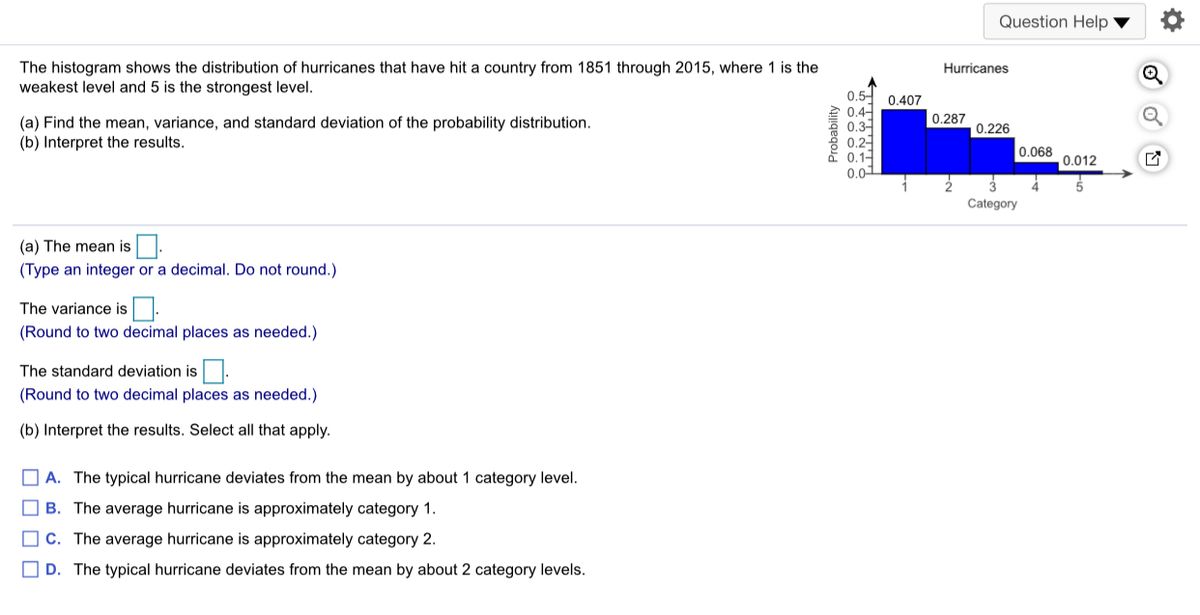
The histogram shows the distribution of hurricanes that have hit a country from 1851 through 2015, where 1 is the weakest level and 5 is the strongest level.
(a) Find the
(b) Interpret the results.
|
Hurricanes
|
(a) The mean is
nothing.
(Type an integer or a decimal. Do not round.)
The variance is
nothing.
(Round to two decimal places as needed.)
The standard deviation is
nothing.
(Round to two decimal places as needed.)
(b) Interpret the results. Select all that apply.
The typical hurricane deviates from the mean by about 1 category level.
The average hurricane is approximately category 1.
The average hurricane is approximately category 2.
The typical hurricane deviates from the mean by about 2 category levels.

Transcribed Image Text:Question Help
The histogram shows the distribution of hurricanes that have hit a country from 1851 through 2015, where 1 is the
weakest level and 5 is the strongest level.
Hurricanes
0.5- 0.407
0.4-
0.31
0.21
0.14
0.0
(a) Find the mean, variance, and standard deviation of the probability distribution.
(b) Interpret the results.
0.287
0.226
0.068
0.012
Category
(a) The mean is.
(Type an integer or a decimal. Do not round.)
The variance is.
(Round to two decimal places as needed.)
The standard deviation is.
(Round to two decimal places as needed.)
(b) Interpret the results. Select all that apply.
O A. The typical hurricane deviates from the mean by about 1 category level.
O B. The average hurricane is approximately category 1.
O C. The average hurricane is approximately category 2.
O D.
The typical hurricane deviates from the mean by about 2 category levels.
Probability
Expert Solution
This question has been solved!
Explore an expertly crafted, step-by-step solution for a thorough understanding of key concepts.

This is a popular solution

Trending nowThis is a popular solution!

Step by stepSolved in 3 steps

Knowledge Booster


Learn more about
Need a deep-dive on the concept behind this application? Look no further. Learn more about this topic, statistics and related others by exploring similar questions and additional content below.Similar questions
- The agency for healthcare research and quality reported that 53% of people who had coronary bypass surgery in a recent year were over the age of 65. Fifteen coronary bypass patients are sampled. Let r= the number of coronary bypass patients over the age of 65. a. What is the mean of this binomial probability distribution? b. What is the variance? c. What is the standard deviation? d. Using the chebyshev's theorem for a minimum percentage of 75%, would it be unusual for 13 coronary bypass patients to be over the age of 65?arrow_forwardA department store manager has monitored the number of complaints received per week about poor service. The probabilities for numbers of complaints in a week, established by this review, are shown in the table. Number of complaints Probability 0 0.16 1 0.26 2 0.35 week? 3 0.10 4 0.08 5 0.05 What is the standard deviation of complaints received per Please round your answer to the nearest hundredth. Note that the correct answer will be evaluated based on the full-precision result you would obtain using Excel.arrow_forwardLost-time accidents occur in a company at a mean rate of 0.3 per day. Using the data above, what is the probability that the number of lost-time accidents occurring over a period of 7 days will be more than 3?arrow_forward
- Customers of a restaurant have been complaining about food poisoning over the past week. A health professional was called to investigate. She tested a representative sample of the eggs and reported that 24% of the sample eggs tested positive for the salmonella bacterium. If a second health professional tests 66 eggs at random, what is the probability that exactly 14 test positive for salmonella? Use a normal distribution to approximate the answer and write it as a decimal rounded to the nearest hundredth.arrow_forwardRent for two-bedroom apartments in Davis, CA, follow a normal distribution with mean of $2,200 and standard deviation of $300. A random sample of 36 two-bedroom homes results in a mean $2,075. What is the probability that the sample mean is greater than or equal to $2,075?arrow_forwardThe full height of a certain species of tree has a normal probability distribution with a mean of 195.6 ft and a standard deviation of 7.5 ft. State the random variable. ¯x = the height of a certain species of tree ¯x = the mean height of a certain species of tree x = the height of a certain species of tree x = the diameter of a certain species of tree A tree of this type grows in my backyard, and it stands 187.4 feet tall. Find the probability that the height of a randomly selected tree is shorter than mine. Round to three decimal places.Which is the notation for the probability that the height is shorter than mine? P(x < 187.4) P(¯x < 195.6) P(¯x > 195.6) P(x > 195.6) P(¯x< 187.4) P(x < 195.6)arrow_forward
arrow_back_ios
arrow_forward_ios
Recommended textbooks for you
- MATLAB: An Introduction with ApplicationsStatisticsISBN:9781119256830Author:Amos GilatPublisher:John Wiley & Sons Inc
 Probability and Statistics for Engineering and th...StatisticsISBN:9781305251809Author:Jay L. DevorePublisher:Cengage Learning
 Statistics for The Behavioral Sciences (MindTap C...StatisticsISBN:9781305504912Author:Frederick J Gravetter, Larry B. WallnauPublisher:Cengage Learning
  Elementary Statistics: Picturing the World (7th E...StatisticsISBN:9780134683416Author:Ron Larson, Betsy FarberPublisher:PEARSON
 The Basic Practice of StatisticsStatisticsISBN:9781319042578Author:David S. Moore, William I. Notz, Michael A. FlignerPublisher:W. H. Freeman
 Introduction to the Practice of StatisticsStatisticsISBN:9781319013387Author:David S. Moore, George P. McCabe, Bruce A. CraigPublisher:W. H. Freeman
MATLAB: An Introduction with Applications
Statistics
ISBN:9781119256830
Author:Amos Gilat
Publisher:John Wiley & Sons Inc
Probability and Statistics for Engineering and th...
Statistics
ISBN:9781305251809
Author:Jay L. Devore
Publisher:Cengage Learning
Statistics for The Behavioral Sciences (MindTap C...
Statistics
ISBN:9781305504912
Author:Frederick J Gravetter, Larry B. Wallnau
Publisher:Cengage Learning
Elementary Statistics: Picturing the World (7th E...
Statistics
ISBN:9780134683416
Author:Ron Larson, Betsy Farber
Publisher:PEARSON
The Basic Practice of Statistics
Statistics
ISBN:9781319042578
Author:David S. Moore, William I. Notz, Michael A. Fligner
Publisher:W. H. Freeman
Introduction to the Practice of Statistics
Statistics
ISBN:9781319013387
Author:David S. Moore, George P. McCabe, Bruce A. Craig
Publisher:W. H. Freeman