Practical Management Science
6th Edition
ISBN: 9781337406659
Author: WINSTON, Wayne L.
Publisher: Cengage,
expand_more
expand_more
format_list_bulleted
Question

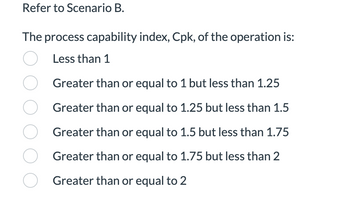
Transcribed Image Text:Refer to Scenario B.
The process capability index, Cpk, of the operation is:
○ Less than 1
O
Greater than or equal to 1 but less than 1.25
Greater than or equal to 1.25 but less than 1.5
O Greater than or equal to 1.5 but less than 1.75
Greater than or equal to 1.75 but less than 2
O Greater than or equal to 2

Transcribed Image Text:SCENARIO B:
A woodcutting operation has a target (nominal) value of 200 inches and consistently averages 200.1 inches with a standard deviation of .05 inches. The design engineers
have established an upper specification limit of 200.25 and a lower specification limit of 199.75 inches.
Expert Solution
This question has been solved!
Explore an expertly crafted, step-by-step solution for a thorough understanding of key concepts.
This is a popular solution
Trending nowThis is a popular solution!
Step by stepSolved in 3 steps

Knowledge Booster
Similar questions
- For the given information, the process capability index (Cpk) = ? (enter your response here) (round your response to two decimal places).arrow_forwardA manager wishes to build a control chart for a process. A total of five (05) samples are collected with eight (08) observations within each sample. The sample means (X-bar) are; 15.36,14.61,16.36,20.28, and 15.77 respectively. Also, the corresponding ranges are; 10.79, 8.37, 2.81,8.17, and 3.31 respectively. The lower and upper control limits of the R-chart are respectively Select one .a 12.84 ,0.54 None is correct .C 15.25 ,0 .d 14.11,0 Le 12.44,0.94 The correct answer is: 0.94, 12.44arrow_forwardA manager wishes to build a control chart for a process. A total of five (05) samples are collected with five (05) observations within each sample. The sample means (X-bar) are; 15.36, 14.61. 16.36, 20.28, and 15.77 respectively. Also, the corresponding ranges are; 10.79,8.37,4.81, 8.17, and 3.31 respectively. The lower and upper control limits of the x-bar chart are ,respectively O a. 16.55, 11.47 Ob. 12.40, 19.72 Oc. 12.36, 20.59 Od. 18.55, 13.47 De. None is correctarrow_forward
- Why are most processes not in statistical control when they are first sampled for control chart purposes? *250 words minimum. Thank you!arrow_forwardPlease do not give solution in image format thankuarrow_forwardIf the process capability ratio of a centered process is 0.7, and the process mean is 76, what is the average amount of defects per 1 million outputs? a. 16395 b. 35729 c. 71861 d. 51176arrow_forward
- A manager wishes to build a 3-sigma range chart for a process. The sample size is five, the mean of sample means is 45.00, and the average range is 7.90. From Table S6.1, the appropriate value of D3 is 0, and D4 is 2.115. What are the UCL and LCL, respectively, for this range chart? (Do not round intermediate calculations. Round final answer to two decimal places.) OA. 12.05 and 0.00 OB. 10.02 and 5.79 O C. 16.71 and 0.00 O D. 68.70 and 21.30 OE. 52.90 and 37.10arrow_forwardUsing the FADE model of quality improvement to reduce patient waiting time and increase patient satisfactionarrow_forwardhelp please answer in text form with proper workings and explanation for each and every part and steps with concept and introduction no AI no copy paste remember answer must be in proper format with all workingarrow_forward
- This exercise contains only parts a and b. a) For the given data, the x= ____ hours (round your response to three decimal places). For the given data, mean range =_____hours (round your response to two decimal places). With z=3, the control limits for the mean chart are: UCLx= ____hours (round your response to three decimal places). LCLx=____hours (round your response to three decimal places). The control limits for the range chart are: UCLR=____hours (round your response to two decimal places). LCLR=h____ours (round your response to two decimal places). With these limits established, West now takes 5 more hours of data, which are shown in the following table. Calculate the mean and range for each hour that the sample data is taken. (Enter your responses for the mean to…arrow_forwardWhat determines the width of the control limits in a process chart?arrow_forwardA call center manager wants to track the number of mistakes that her staff makes on a daily basis. She gathered the following number of mistakes each day last week: Monday 12, Tuesday 20, Wednesday 8, Thursday 10, and Friday 18. What would be the upper control limit for the c-chart? OA. 92.74 OB. 54.40 OC. 20.00 O D. 17.29 OE. 24.66arrow_forward
arrow_back_ios
SEE MORE QUESTIONS
arrow_forward_ios
Recommended textbooks for you
 Practical Management ScienceOperations ManagementISBN:9781337406659Author:WINSTON, Wayne L.Publisher:Cengage,
 Operations ManagementOperations ManagementISBN:9781259667473Author:William J StevensonPublisher:McGraw-Hill Education
 Operations and Supply Chain Management (Mcgraw-hi...Operations ManagementISBN:9781259666100Author:F. Robert Jacobs, Richard B ChasePublisher:McGraw-Hill Education
 Purchasing and Supply Chain ManagementOperations ManagementISBN:9781285869681Author:Robert M. Monczka, Robert B. Handfield, Larry C. Giunipero, James L. PattersonPublisher:Cengage Learning
 Production and Operations Analysis, Seventh Editi...Operations ManagementISBN:9781478623069Author:Steven Nahmias, Tava Lennon OlsenPublisher:Waveland Press, Inc.

Practical Management Science
Operations Management
ISBN:9781337406659
Author:WINSTON, Wayne L.
Publisher:Cengage,

Operations Management
Operations Management
ISBN:9781259667473
Author:William J Stevenson
Publisher:McGraw-Hill Education

Operations and Supply Chain Management (Mcgraw-hi...
Operations Management
ISBN:9781259666100
Author:F. Robert Jacobs, Richard B Chase
Publisher:McGraw-Hill Education


Purchasing and Supply Chain Management
Operations Management
ISBN:9781285869681
Author:Robert M. Monczka, Robert B. Handfield, Larry C. Giunipero, James L. Patterson
Publisher:Cengage Learning

Production and Operations Analysis, Seventh Editi...
Operations Management
ISBN:9781478623069
Author:Steven Nahmias, Tava Lennon Olsen
Publisher:Waveland Press, Inc.