
MATLAB: An Introduction with Applications
6th Edition
ISBN: 9781119256830
Author: Amos Gilat
Publisher: John Wiley & Sons Inc
expand_more
expand_more
format_list_bulleted
Related questions
Concept explainers
Topic Video
Question

Transcribed Image Text:Unit 4: Data Management
Final Requirement For Unit 4
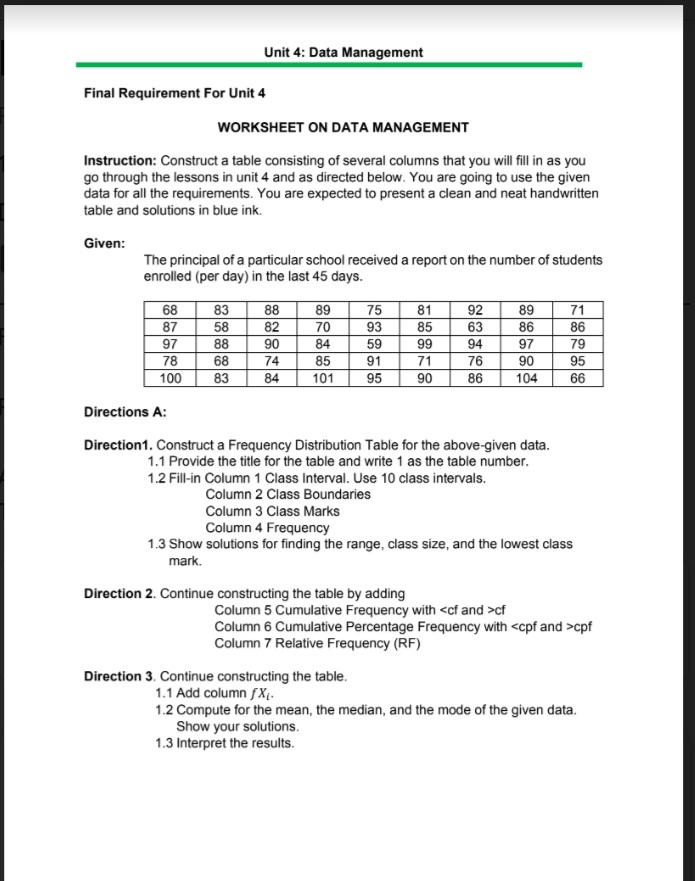
WORKSHEET ON DATA MANAGEMENT
Instruction: Construct a table consisting of several columns that you will fill in as you
go through the lessons in unit 4 and as directed below. You are going to use the given
data for all the requirements. You are expected to present a clean and neat handwritten
table and solutions in blue ink.
Given:
The principal of a particular school received a report on the number of students
enrolled (per day) in the last 45 days.
68
87
97
78
71
86
79
83
88
89
70
75
81
92
89
58
82
93
85
63
86
88
90
84
59
99
94
97
68
74
85
91
71
76
90
95
100
83
84
101
95
90
86
104
66
Directions A:
Direction1. Construct a Frequency Distribution Table for the above-given data.
1.1 Provide the title for the table and write 1 as the table number.
1.2 Fill-in Column 1 Class Interval. Use 10 class intervals.
Column 2 Class Boundaries
Column 3 Class Marks
Column 4 Frequency
1.3 Show solutions for finding the range, class size, and the lowest class
mark.
Direction 2. Continue constructing the table by adding
Column 5 Cumulative Frequency with <cf and >cf
Column 6 Cumulative Percentage Frequency with <cpf and >cpf
Column 7 Relative Frequency (RF)
Direction 3. Continue constructing the table.
1.1 Add column fX4.
1.2 Compute for the mean, the median, and the mode of the given data.
Show your solutions.
1.3 Interpret the results.
に
Expert Solution
This question has been solved!
Explore an expertly crafted, step-by-step solution for a thorough understanding of key concepts.

This is a popular solution

Trending nowThis is a popular solution!

Step by stepSolved in 2 steps

Knowledge Booster


Learn more about
Need a deep-dive on the concept behind this application? Look no further. Learn more about this topic, statistics and related others by exploring similar questions and additional content below.Similar questions
- Q.9arrow_forwardThe following data show the ages of recent award-winning male actors at the time when they won their award. Make a frequency table for the data, using bins of 20-29, 30-39, and so on. Click the icon to view the ages of male actors. Complete the table below. Age 20-29 30-39 40-49 50-59 60-69 70-79 No. of actors ☐☐☐☐☐☐ Data table 20 54 34 41 50 59 48 34 31 65 44 28 79 49 48 34 59 59 34 44 48 31 43 35 63 58 35 49 41 77 43 C 57 30 38 D - Xarrow_forwardThe following data show the ages of recent award-winning male actors at the time when they won their award. Make a frequency table for the data, using bins of 20-29, 30-39, and so on. Click the icon to view the ages of male actors. Complete the table below. Age No. of actors Data Table 20-29 30-39 40-49 36 53 23 67 53 56 48 39 49 52 50-59 37 49 50 46 31 42 65 57 73 33 60-69 53 41 31 49 41 35 39 46 48 34 70-79 35 63 42 37 Print Donearrow_forward
- The following data set outlines the scores students had on an Algebra test. 41 42 43 43 43 43 43 44 44 44 44 45 45 45 45 i) Fill in the frequency table (below) Scores 7 6 5 4 3 2 40 43 44 45 1 39 ii) Draw a dot plot on the graph below. You do not need to show the entire column of dots, only the one on the top representing the frequency of the test score. Score 40 40 41 42 43 44 45 19 41 42 13 43 Frequency 44 45 40arrow_forwardAnswer all questionsarrow_forwardThe following is a frequency histogram and a box plot showing the annual salary distribution at a small company. 2- 30 40 50 60 70 80 90 100 110 120 130 140 150 Annual Salary (in thousands of $) Number of Employees 4.arrow_forward
arrow_back_ios
arrow_forward_ios
Recommended textbooks for you
- MATLAB: An Introduction with ApplicationsStatisticsISBN:9781119256830Author:Amos GilatPublisher:John Wiley & Sons Inc
 Probability and Statistics for Engineering and th...StatisticsISBN:9781305251809Author:Jay L. DevorePublisher:Cengage Learning
 Statistics for The Behavioral Sciences (MindTap C...StatisticsISBN:9781305504912Author:Frederick J Gravetter, Larry B. WallnauPublisher:Cengage Learning
  Elementary Statistics: Picturing the World (7th E...StatisticsISBN:9780134683416Author:Ron Larson, Betsy FarberPublisher:PEARSON
 The Basic Practice of StatisticsStatisticsISBN:9781319042578Author:David S. Moore, William I. Notz, Michael A. FlignerPublisher:W. H. Freeman
 Introduction to the Practice of StatisticsStatisticsISBN:9781319013387Author:David S. Moore, George P. McCabe, Bruce A. CraigPublisher:W. H. Freeman
MATLAB: An Introduction with Applications
Statistics
ISBN:9781119256830
Author:Amos Gilat
Publisher:John Wiley & Sons Inc
Probability and Statistics for Engineering and th...
Statistics
ISBN:9781305251809
Author:Jay L. Devore
Publisher:Cengage Learning
Statistics for The Behavioral Sciences (MindTap C...
Statistics
ISBN:9781305504912
Author:Frederick J Gravetter, Larry B. Wallnau
Publisher:Cengage Learning
Elementary Statistics: Picturing the World (7th E...
Statistics
ISBN:9780134683416
Author:Ron Larson, Betsy Farber
Publisher:PEARSON
The Basic Practice of Statistics
Statistics
ISBN:9781319042578
Author:David S. Moore, William I. Notz, Michael A. Fligner
Publisher:W. H. Freeman
Introduction to the Practice of Statistics
Statistics
ISBN:9781319013387
Author:David S. Moore, George P. McCabe, Bruce A. Craig
Publisher:W. H. Freeman