A First Course in Probability (10th Edition)
10th Edition
ISBN: 9780134753119
Author: Sheldon Ross
Publisher: PEARSON
expand_more
expand_more
format_list_bulleted
Question

Transcribed Image Text:The population mean and standard deviation are given below. Find the required probability and determine whether the given sample mean would be considered unusual.
For a sample of n = 61, find the probability of a sample mean being less than 22.6 if µ = 23 and o = 1.15.
Click the icon to view page 1 of the standard normal table.
Click the icon to view page 2 of the standard normal table.
For a sample of n = 61, the probability of a sample mean being less than 22.6 if µ = 23 and o=1.15 is
(Round to four decimal places as needed.)
Help me solve this
View an example Get more help.
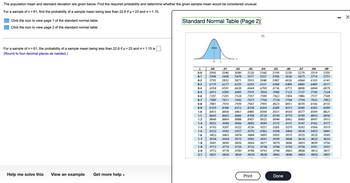
Standard Normal Table (Page 2)
Z
0.0
0.1
0.2
0.3
0.4
0.5
0.6
0.7
0.8
0.9
1.0
1.1
1.2
1.3
1.4
1.5
1.6
1.7
1.8
1.9
2.0
2.1
Area
0
Z
.03
.04
.00
.01
.02
.05
.06
.07
.08
.09
.5000 .5040 .5080 .5120 5160 .5199 .5239 .5279 .5319 .5359
.5398 .5438 5478 .5517 .5557 .5596 .5636 .5675 .5714 .5753
.5793 5832 .5871 .5910 .5948 5987 .6026 .6064 .6103 .6141
.6179 .6217 .6255 .6293 .6331 .6368 .6406 .6443 .6480 .6517
.6554 .6591 .6628 .6664 .6700 .6736 .6772 .6808 .6844 .6879
.6915 .6950 .6985 .7019 .7054 .7088
7123 .7157 .7190 7224
.7257 .7291 .7324 .7357 .7389 .7422 7454 .7486 .7517 .7549
.7580
.7611 .7642 .7673 .7704 7734
.7764 7794 .7823 7852
.7881 .7910 .7939 .7967 .7995 .8023 8051 .8078 .8106 8133
.8159 .8186 .8212 8238 .8264 .8289 .8315 .8340 .8365 8389
8413 .8438 .8461 .8485 8508
.8531 .8554 .8577 8599 8621
.8643 .8665 .8686 8708 .8729 .8749 .8770 .8790 .8810 .8830
.8849 8869 .8888 .8907 .8925
.8944
8962 .8980 .8997 .9015
.9032 .9049 .9066 .9082 .9099 9115 .9131 .9147 .9162 .9177
9192
.9207 .9222 .9236 .9251 .9265 .9279 .9292 .9306 .9319
.9332 .9345 9357 .9370 .9382 .9394 .9406 .9418 9429 .9441
.9452 .9463 .9474 .9484 .9495 .9505 .9515 .9525 .9535 .9545
.9554 .9564 9573 .9582 .9591 .9599 .9608 .9616 .9625 .9633
.9641 .9649 .9656 .9664 .9671 .9678 .9686 .9693 .9699 .9706
.9713 .9719 .9726 .9732 .9738 .9744 .9750 .9756 .9761 .9767
.9772 .9778 9783 9788 .9793 .9798 .9803 .9808 .9812
.9821 .9826 .9830 .9834 .9838 .9842 .9846 9850 .9854
.9817
.9857
Print
Done
X

Transcribed Image Text:The population mean and standard deviation are given below. Find the required probability and determine whether the given sample mean would be considered unusual.
For a sample of n = 61, find the probability of a sample mean being less than 22.6 if µ = 23 and o = 1.15.
Click the icon to view page 1 of the standard normal table.
Click the icon to view page 2 of the standard normal table.
For a sample of n = 61, the probability of a sample mean being less than 22.6 if µ = 23 and o=1.15 is
(Round to four decimal places as needed.)
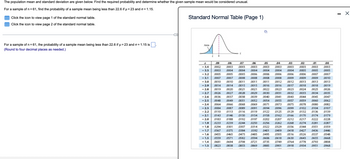
Standard Normal Table (Page 1)
Area
Z
Z
.05
.00
-3.4
-3.3
-3.2
-3.1
-3.0
-2.9
-2.8
.09
.08
.07
.06
.04
.03
.02
.01
.0002 .0003 .0003 .0003 .0003 0003 .0003 .0003 .0003 .0003
.0003 .0004 .0004 .0004 .0004 0004 .0004 .0005 .0005 .0005
.0005 .0005 .0005 .0006 .0006 0006 .0006 .0006 .0007 .0007
.0007 .0007 .0008 .0008 .0008 .0008 .0009 .0009 .0009 .0010
.0010 .0010 .0011 .0011 .0011 0012 .0012 .0013 .0013 .0013
.0014 .0014 .0015 .0015 .0016 .0016 .0017 .0018 .0018 .0019
.0019 .0020
.0021 .0021 .0022
0023 .0023 .0024 .0025 .0026
-2.7 .0026 .0027 .0028 .0029 .0030 0031 .0032 .0033 .0034 .0035
-2.6 .0036 .0037 .0038 .0039 .0040 0041 .0043 .0044 .0045 .0047
-2.5 .0048 .0049 .0051 .0052 .0054 0055 .0057 .0059 .0060 .0062
-2.4
.0064 .0066 .0068 .0069 .0071 .0073 .0075 .0078 .0080 .0082
-2.3 .0084 .0087 .0089 .0091 .0094 0096 .0099
0102 .0104 0107
-2.2 .0110 .0113 .0116 .0119 0122 0125 .0129 0132 .0136 0139
-2.1 .0143 .0146 .0150 .0154 .0158 .0162 .0166 0170 .0174 0179
-2.0 .0183 .0188 .0192 .0197
.0202 0207 .0212 .0217 .0222 0228
-1.9 0233 .0239 .0244 .0250 .0256 0262 .0268 .0274 .0281 .0287
-1.8 .0294 0301 .0307 .0314 0322 0329 .0336 .0344 .0351 0359
-1.7 .0367 .0375 0384 .0392 .0401 0409 .0418
0427
.0436
-1.6 .0455 0465 .0475 .0485 .0495 0505 .0516 .0526 .0537
<<-1.5 .0559 .0571 .0582 .0594 .0606 0618 .0630 .0643 .0655
-1.4 .0681 .0694 0708 .0721
.0735 0749 .0764 .0778 .0793
-1.3 .0823 .0838 0853 .0869 0885 0901 .0918 0934 .0951
.0446
.0548
0668
0808
0968
X
Expert Solution
This question has been solved!
Explore an expertly crafted, step-by-step solution for a thorough understanding of key concepts.
This is a popular solution
Trending nowThis is a popular solution!
Step by stepSolved in 2 steps

Knowledge Booster
Similar questions
- According to one study, brain weights of men are normally distributed with a mean of 1.10 kg and a standard deviation of 0.12 kg. Use the data to answer parts (a) through (e). Click here to view page 1 of the table of areas under the standard normal curve. Click here to view page 2 of the table of areas under the standard normal curve. a. Determine the sampling distribution of the sample mean for samples of size 3. Interpret your answer in terms of the distribution of all possible sample mean brain weights for samples of three men. The mean of the sample mean is µ, kg. (Type an integer or a decimal. Do not round.) The standard deviation of the sample mean is o, = kg. (Round to four decimal places as needed.) Interpret these answers in context. For the brain weights have a normal distribution with a mean of kg and a standard deviation of kg. (Type integers or decimals rounded to four decimal places as needed.) b. Repeat part (a) for samples of size 12. The mean of the sample mean is µ;…arrow_forwardCAN YOU PLEASE ANSWER THE WHOLE THING?arrow_forwardPlease answer quickly!arrow_forward
- Please see pictures for details of question.arrow_forwardThe population mean and standard deviation are given below. Find the required probability and determine whether the given sample mean would be considered unusual. For a sample of n = 63, find the probability of a sample mean being less than 19.5 if u = 20 and o=1.33. Click the icon to view page 1 of the standard normal table. Click the icon to view page 2 of the standard normal table. For a sample of n = 63, the probability of a sample mean being less than 19.5 if u = 20 and σ = 1.33 is (Round to four decimal places as needed.) Would the given sample mean be considered unusual? The sample mean be considered unusual because it has a probability that is than 5%.arrow_forwardA set of five different whole numbers are arranged in order from smallest to largest. The firstand last numbers are decreased by one. Which measure of spread for the set could thischange?a. The range. c. The standard deviation.b. The median. d) all of the abovearrow_forward
- The numbers of regular season wins for 10 football teams in a given season are given below. Determine the range, mean, variance, and standard deviation of the population data set. 2, 7, 15, 4, 12, 10, 13, 9, 5, 7arrow_forwardThe set of all possible values of a sample statistic is called a A. simple random sample. B. point estimate. C. census. D. sampling distribution.arrow_forward
arrow_back_ios
arrow_forward_ios
Recommended textbooks for you
 A First Course in Probability (10th Edition)ProbabilityISBN:9780134753119Author:Sheldon RossPublisher:PEARSON

A First Course in Probability (10th Edition)
Probability
ISBN:9780134753119
Author:Sheldon Ross
Publisher:PEARSON
