MATLAB: An Introduction with Applications
6th Edition
ISBN: 9781119256830
Author: Amos Gilat
Publisher: John Wiley & Sons Inc
expand_more
expand_more
format_list_bulleted
Concept explainers
Topic Video
Question
thumb_up100%


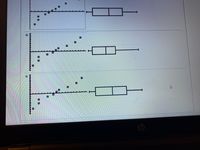
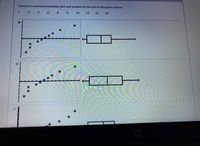
Transcribed Image Text:Construct a normal probability plot and boxplot for the set of data given below:
1
3 3 6 8 9
10
13
16
18
Expert Solution
This question has been solved!
Explore an expertly crafted, step-by-step solution for a thorough understanding of key concepts.
This is a popular solution
Trending nowThis is a popular solution!
Step by stepSolved in 3 steps with 1 images

Knowledge Booster
Learn more about
Need a deep-dive on the concept behind this application? Look no further. Learn more about this topic, statistics and related others by exploring similar questions and additional content below.Similar questions
- All of the following are descriptive statistics EXCEPT a. independent samples t-testb. medianc. variance d. frequency tablesarrow_forwardFind the variance of the following: 12.0, 9.5, 10.5, 18.4, 33.1, 41.7, 50.6, 29.9, 23.0.arrow_forwardState whether you would expect this distribution to be symmetric, left-skewed, orright-skewed, and briefly explain: ages of people obtaining a driver’s license for the firsttime.arrow_forward
- Draw the box-and-whisker plot and give the five-number summary for each data set. Number of games won by the Detroit Lions in their last 10 seasons: minumim:________ (9,7,11,7,4,10,6,2,0,7) Lower Quartile:________ Median:______________ Upper Quartile:_____________ Maximum_______________arrow_forwardA developmental psychologist is interested in studying how long babies gaze at a photograph of a human face. To test this question, she shows a picture to a sample of six babies and records the length of their gaze in seconds. The data are as follows: 12, 17, 18, 20, 20, 29. Calculate the mean, median, mode, range, variance and standard deviation for the sample.arrow_forwardCalculate the variance for the following dataset: 15 17 17 5 5arrow_forward
- need help please!arrow_forwardSuppose that warranty records for a car maker show that the probability that a new car needs a warranty repair in the first 90 days is 20%. If a random sample of 20 new cars is selected, what is the probability that more than 6 will need a warranty repair? 0.0321 0.9133 0.0867 0.1091arrow_forwardThe following sample observations were randomly selected: X Y 5 4 10 7 3 7 4 6 6 5 What is the coefficient of correlation? Select one: a. 0.185 b. 0.001 c. 0.034 d. 0.089arrow_forward
- A researcher wants to know if there is a difference between the mean amount of sleep that people get for various types of employment status. The table below shows data that was collected from a survey. Unemployed Part Time Worker Full Time Worker 9 7 7 9 9 5 7 7 7 7 8 8 9 6 7 10 7 8 10 9 5 8 8 8 9 Assume that all distributions are normal, the three population standard deviations are all the same, and the data was collected independently and randomly. Use a level of significance of α=0.1α=0.1.H0: μ1=μ2=μ3H0: μ1=μ2=μ3Ha:Ha: At least two of the means differ from each other. For this study, we should use The test-statistic for this data = (Please show your answer to 4 decimal places.) The p-value for this sample = (Please show your answer to 4 decimal places.)arrow_forwardWhat the variance for the following Sample of n - 3 scores? Scores: 1, 4, 7 06 15 3.arrow_forwardDefine a. normally distributed variable.b. normally distributed population.c. parameters for a normal curve.arrow_forward
arrow_back_ios
SEE MORE QUESTIONS
arrow_forward_ios
Recommended textbooks for you
 MATLAB: An Introduction with ApplicationsStatisticsISBN:9781119256830Author:Amos GilatPublisher:John Wiley & Sons Inc
 Probability and Statistics for Engineering and th...StatisticsISBN:9781305251809Author:Jay L. DevorePublisher:Cengage Learning
 Statistics for The Behavioral Sciences (MindTap C...StatisticsISBN:9781305504912Author:Frederick J Gravetter, Larry B. WallnauPublisher:Cengage Learning
 Elementary Statistics: Picturing the World (7th E...StatisticsISBN:9780134683416Author:Ron Larson, Betsy FarberPublisher:PEARSON
 The Basic Practice of StatisticsStatisticsISBN:9781319042578Author:David S. Moore, William I. Notz, Michael A. FlignerPublisher:W. H. Freeman
 Introduction to the Practice of StatisticsStatisticsISBN:9781319013387Author:David S. Moore, George P. McCabe, Bruce A. CraigPublisher:W. H. Freeman

MATLAB: An Introduction with Applications
Statistics
ISBN:9781119256830
Author:Amos Gilat
Publisher:John Wiley & Sons Inc

Probability and Statistics for Engineering and th...
Statistics
ISBN:9781305251809
Author:Jay L. Devore
Publisher:Cengage Learning

Statistics for The Behavioral Sciences (MindTap C...
Statistics
ISBN:9781305504912
Author:Frederick J Gravetter, Larry B. Wallnau
Publisher:Cengage Learning

Elementary Statistics: Picturing the World (7th E...
Statistics
ISBN:9780134683416
Author:Ron Larson, Betsy Farber
Publisher:PEARSON

The Basic Practice of Statistics
Statistics
ISBN:9781319042578
Author:David S. Moore, William I. Notz, Michael A. Fligner
Publisher:W. H. Freeman

Introduction to the Practice of Statistics
Statistics
ISBN:9781319013387
Author:David S. Moore, George P. McCabe, Bruce A. Craig
Publisher:W. H. Freeman