MATLAB: An Introduction with Applications
6th Edition
ISBN: 9781119256830
Author: Amos Gilat
Publisher: John Wiley & Sons Inc
expand_more
expand_more
format_list_bulleted
Question
thumb_up100%

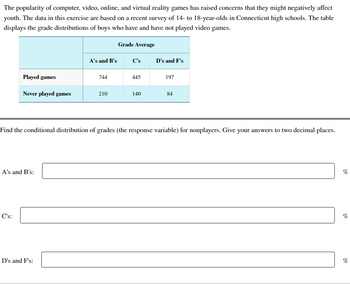
Transcribed Image Text:The popularity of computer, video, online, and virtual reality games has raised concerns that they might negatively affect
youth. The data in this exercise are based on a recent survey of 14- to 18-year-olds in Connecticut high schools. The table
displays the grade distributions of boys who have and have not played video games.
Played games
Never played games
A's and B's:
C's:
A's and B's
D's and F's:
744
210
Grade Average
C's
445
140
D's and F's
Find the conditional distribution of grades (the response variable) for nonplayers. Give your answers to two decimal places.
197
84
%
%
%

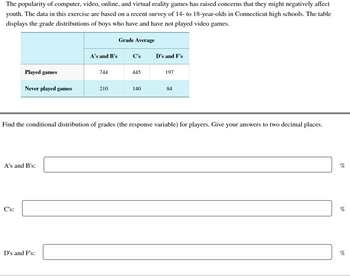
Transcribed Image Text:The popularity of computer, video, online, and virtual reality games has raised concerns that they might negatively affect
youth. The data in this exercise are based on a recent survey of 14- to 18-year-olds in Connecticut high schools. The table
displays the grade distributions of boys who have and have not played video games.
Played games
Never played games
C's:
A's and B's:
A's and B's
D's and F's:
744
210
Grade Average
C's
445
140
D's and F's
Find the conditional distribution of grades (the response variable) for players. Give your answers to two decimal places.
197
84
%
%
%
Expert Solution
This question has been solved!
Explore an expertly crafted, step-by-step solution for a thorough understanding of key concepts.
This is a popular solution
Trending nowThis is a popular solution!
Step by stepSolved in 3 steps with 13 images

Knowledge Booster
Similar questions
- What is the median?arrow_forwardConsider the following data. −1,2,2,−4,−4,−1−1,2,2,−4,−4,−1 Determine the mean of the given data.arrow_forwardTwenty-nine college students, identified as having a positive attitude about Mitt Romney as compared to Barack Obama in the 2012 presidential election, were asked to rate how trustworthy the face of Mitt Romney appeared, as represented in their mental image of Mitt Romney’s face. Ratings were on a scale of 0 to 7, with 0 being “not at all trustworthy” and 7 being “extremely trustworthy.” Here are the 29 ratings: 2.6 3.2 3.7 3.3 3.4 3.6 3.7 3.8 3.9 4.1 4.2 4.9 5.7 4.2 3.9 3.2 4.5 5.0 5.0 4.6 4.6 3.9 3.9 5.3 2.8 2.6 3.0 3.3 3.7 a 95% confidence interval for the mean rating. Is there significant evidence at the 5% level that the mean rating is greater than 3.5 (a neutral rating)?arrow_forward
- A County Board of Supervisors has appointed an urban planning committee to evaluate proposed community development projects. The committee is analyzing, among other things, data on household incomes in two cities within the county. They have collected data on the income of 77 households in each of the two cities. The histograms below show the distributions of the two sets of incomes (in thousands of dollars). Each histogram shows household income on the horizontal axis and number of households on the vertical axis. The means and standard deviations for the data sets are also given. City A City B 25+ 20+ 15+ 10+ 5- ← 10 20 30 40 50 60 70 80 90 100 City A mean: 73.96 thousand dollars City A standard deviation: 20.30 thousand dollars Explanation 25- 20- 15- 104 5+ 10 (a) Identify the data set for which it is appropriate to use the Empirical Rule. It is appropriate to use the Empirical Rule for the (Choose one) ▼ data set. 20 30 The committee wants to use the Empirical Rule to make some…arrow_forwardASK YOUR TEACHER The superintendent of a school district wants to determine if there is a statistically significant correlation between expenditures and test scores. She finds the top 10 Sonoma County school districts, ranked by spending, and the test scores shown in the table. Top 10 Sonoma County School Districts by Spending f dollars District Expenditure Test Score (API) Horicon $20,136 676 Fort Ross 17,123 767 Montgomery 16,539 844 Monte Fio 14,280 872 Kenwood 13,248 871 Geyserville 12,499 776 Alexander Valley 11,640 894 Harmony 11,353 863 Two Rock 10,406 866 Roseland 10,059 779 What is the correlation between the expenditure (x) and the test score (y)? (Round your answer to four decimal places.) r = Is this correlation significant at either the 5% or the 1% significance level? Yes, there is a correlation. It is significant at the 1% level. Yes, there is a correlation. It is significant at the 5% level. O No, there is no significant correlation. Need Help? Reid it Additional…arrow_forwardAn industrial-organizational psychologist is interested in discovering the relationship between the tempo of preferred music that is played in a workplace and employee mood. Employees chose their favorite song on an MP3 player and then reported their moods when listening to that piece of music. A total of 10 participants were asked individually and brought in their own MP3 players; the least number of songs on an employee's MP3 player was 350. The sample data are presented as a scatterplot below. The psychologist wants to use a Pearson correlation coefficient to analyze the relationship. Considering the assumptions for this statistic, which of these statements is the correct course of action? A. The researcher has chosen the wrong statistic to represent this relationship. B. The researcher has violated a robust assumption and should be able to calculate r. C. The researcher has chosen the right statistic because all the assumptions are valid. D. The researcher has violated a…arrow_forward
- A scatter diagram can be used to visualize a pattern to the data. O True O Falsearrow_forwardA study is planned to compare the proportion of teenagers (ages 13–19) who dislike anchovies with the proportion of young adults (ages 20–30) who dislike anchovies. A random sample of 41 teenagers was taken, and 78% of them disliked anchovies. A random sample of 56 young adults was also taken, and 71% of them disliked anchovies. Difference = Teenagers - Young Adults The picture below is the question. Use the information above to help.arrow_forward
arrow_back_ios
arrow_forward_ios
Recommended textbooks for you
 MATLAB: An Introduction with ApplicationsStatisticsISBN:9781119256830Author:Amos GilatPublisher:John Wiley & Sons Inc
 Probability and Statistics for Engineering and th...StatisticsISBN:9781305251809Author:Jay L. DevorePublisher:Cengage Learning
 Statistics for The Behavioral Sciences (MindTap C...StatisticsISBN:9781305504912Author:Frederick J Gravetter, Larry B. WallnauPublisher:Cengage Learning
 Elementary Statistics: Picturing the World (7th E...StatisticsISBN:9780134683416Author:Ron Larson, Betsy FarberPublisher:PEARSON
 The Basic Practice of StatisticsStatisticsISBN:9781319042578Author:David S. Moore, William I. Notz, Michael A. FlignerPublisher:W. H. Freeman
 Introduction to the Practice of StatisticsStatisticsISBN:9781319013387Author:David S. Moore, George P. McCabe, Bruce A. CraigPublisher:W. H. Freeman

MATLAB: An Introduction with Applications
Statistics
ISBN:9781119256830
Author:Amos Gilat
Publisher:John Wiley & Sons Inc

Probability and Statistics for Engineering and th...
Statistics
ISBN:9781305251809
Author:Jay L. Devore
Publisher:Cengage Learning

Statistics for The Behavioral Sciences (MindTap C...
Statistics
ISBN:9781305504912
Author:Frederick J Gravetter, Larry B. Wallnau
Publisher:Cengage Learning

Elementary Statistics: Picturing the World (7th E...
Statistics
ISBN:9780134683416
Author:Ron Larson, Betsy Farber
Publisher:PEARSON

The Basic Practice of Statistics
Statistics
ISBN:9781319042578
Author:David S. Moore, William I. Notz, Michael A. Fligner
Publisher:W. H. Freeman

Introduction to the Practice of Statistics
Statistics
ISBN:9781319013387
Author:David S. Moore, George P. McCabe, Bruce A. Craig
Publisher:W. H. Freeman