
MATLAB: An Introduction with Applications
6th Edition
ISBN: 9781119256830
Author: Amos Gilat
Publisher: John Wiley & Sons Inc
expand_more
expand_more
format_list_bulleted
Related questions
Question

Transcribed Image Text:K
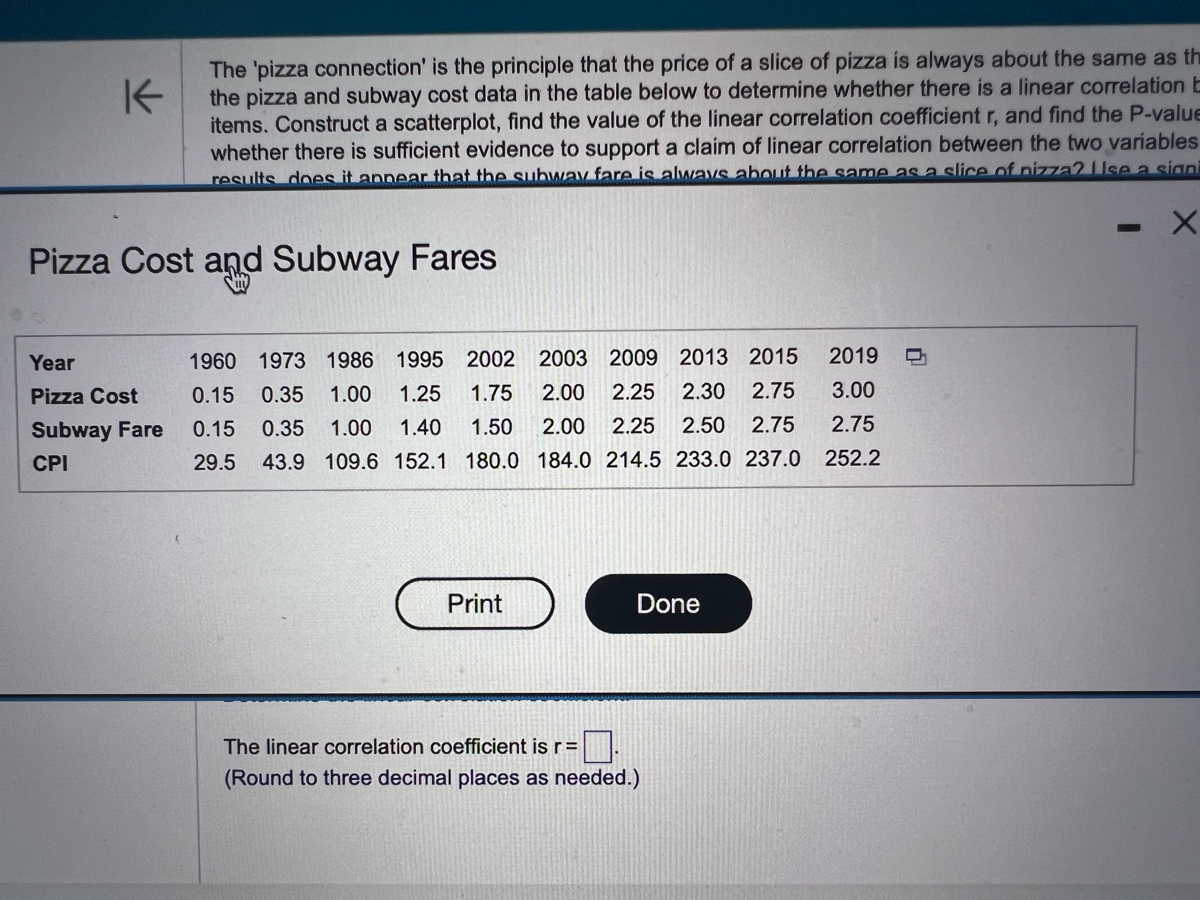
The 'pizza connection' is the principle that the price of a slice of pizza is always about the same as th
the pizza and subway cost data in the table below to determine whether there is a linear correlation b
items. Construct a scatterplot, find the value of the linear correlation coefficient r, and find the P-value
whether there is sufficient evidence to support a claim of linear correlation between the two variables
results does it appear that the subway fare is always about the same as a slice of pizza? Use a signi
X
Pizza Cost and Subway Fares
Year
Pizza Cost
Subway Fare
CPI
1960 1973 1986 1995 2002 2003 2009 2013 2015 2019 D
0.15 0.35 1.00 1.25 1.75 2.00 2.25 2.30 2.75 3.00
0.15 0.35 1.00 1.40 1.50 2.00 2.25 2.50 2.75 2.75
29.5 43.9 109.6 152.1 180.0 184.0 214.5 233.0 237.0
252.2
Print
Done
The linear correlation coefficient is r =
(Round to three decimal places as needed.)

Transcribed Image Text:The 'pizza connection' is the principle that the price of a slice of pizza is always about the same as the subway fare. Use
the pizza and subway cost data in the table below to determine whether there is a linear correlation between these two
items. Construct a scatterplot, find the value of the linear correlation coefficient r, and find the P-value of r. Determine
whether there is sufficient evidence to support a claim of linear correlation between the two variables. Based on these
results, does it appear that the subway fare is always about the same as a slice of pizza? Use a significance level of
x=0.05.
Click here for data on pizza costs and subway fares over the years.
Construct a scatterplot. Choose the correct graph below.
A.
Pizza slice cost
3.5-
0-
3.5
0
Subway Fare
B.
3.5-
1st 12:
0
3.5
Subway Fare
Determine the linear correlation coefficient.
The linear correlation coefficient is r=
(Round to three decimal places as needed.)
Pizza slice cost
3.5-
0++
3.5
Q
0
Subway Fare
D.
3.5
Subway Fare
Sc
3-
Scre
Expert Solution
This question has been solved!
Explore an expertly crafted, step-by-step solution for a thorough understanding of key concepts.

This is a popular solution

Trending nowThis is a popular solution!

Step by stepSolved in 3 steps with 2 images

Knowledge Booster

Similar questions
- Listed below are amounts of court income and salaries paid to the town justices. All amounts are in thousands of dollars. Construct a scatterplot, find the value of the linear correlation coefficient r, and find the P-value using a = 0.05. Is there sufficient evidence to conclude that there is a linear correlation between court incomes and justice salaries? Based on the results, does it appear that justices might profit by levying larger fines? Court Income 65.0 406.0 1566.0 1130.0 273.0 251.0 112.0 152.0 32.0 Justice Salary 31 45 92 58 44 60 24 25 18 B. Ho:p=0 A. Ho:p=0 H4:p#0 H:p>0 O C. Ho: p=0 H4:p<0 O D. Ho: p+0 H1:p=0 Construct a scatterplot. Choose the correct graph below. O A. В. O D. AJustice Salary 100- AJustice Salary 100- A Justice Salary 100- AJustice Salary 100- 50- 50- 50- 50- 0- 0- 0- 800 1600 800 1600 800 1600 800 1600 Court Income Court Income Court Income Court Income The linear correlation coefficient is r= (Round to three decimal places as needed.)arrow_forwardListed below are annual data for various years. The data are weights (metric tons) of imported lemons and car crash fatality rates per 100,000 population. Construct a scatterplot, find the value of the linear correlation coefficient r, and find the P-value using a = 0.05. Is there sufficient evidence to conclude that there is a linear correlation between lemon imports and crash fatality rates? Do the results suggest that imported lemons cause car fatalities? Lemon Imports Crash Fatality Rate 229 266 359 480 530 15.9 15.6 15.5 15.3 14.9 Construct a scatterplot. Choose the correct graph below. OA. В. Ос. D. Ay 17- Ay 17- Ay 17- Ay 17- 16- 16- 16- 16- 15- 15- 15- 15- 14+ 14+ 14- 14+ 200 400 600 200 400 600 200 400 600 200 400 600 The linear correlation coefficient r is (Round to three decimal places as needed.)arrow_forwardListed below are annual data for various years. The data are weights (metric tons) of imported lemons and car crash fatality rates per 100,000 population. Construct a scatterplot, find the value of the linear correlation coefficient r, and find the P-value using a = 0.05. Is there sufficient evidence to conclude that there is a linear correlation between lemon imports and crash fatality rates? Do the results suggest that imported lemons cause car fatalities? Lemon Imports Crash Fatality Rate 231 266 359 480 532 15.9 15.7 15.4 15.2 14.8 Ay 17- Ay 17- Ay 17+ Ay 17- 16- 16- 16- 16- 15- 15- 15- 15- X 14- 14+ 14- 14- 200 400 600 200 400 600 200 400 600 200 400 600 The linear correlation coefficient r is (Round to three decimal places as needed.) The P-value is (Round to three decimal places as needed.) Because the P-value is than the significance level 0.05, there sufficient evidence to support the claim that there is a linear correlation between lemon imports and crash fatality rates for a…arrow_forward
- Listed below are annual data for various years. The data are weights (metric tons) of imported lemons and car crash fatality rates per 100,000 population. Construct a scatterplot, find the value of the linear correlation coefficient r, and find the P-value using a = 0.05. Is there sufficient evidence to conclude that there is a linear correlation between lemon imports and crash fatality rates? Do the results suggest that imported lemons cause car fatalities? Lemon Imports Crash Fatality Rate 228 264 358 482 531 15.9 15.7 15.5 15.3 14.9arrow_forwardListed below are annual data for various years. The data are weights (metric tons) of imported lemons and car crash fatality rates per 100,000 population. Construct a scatterplot, find the value of the linear correlation coefficient r, and find the P-value using a= 0.05. Is there sufficient evidence to conclude that there is a linear correlation between lemon imports and crash fatality rates? Do the results suggest that imported lemons cause car fatalities? Lemon Imports Crash Fatality Rate 266 15.7 228 358 484 531 15.8 15.5 15.2 14.8 What are the null and alternative hypotheses? O B. Ho: p=0 O A. Ho: p#0 H1:p=0 H1:p0 H,: p#0 Construct a scatterplot. Choose the correct graph below. OA. B. Oc. OD. Ay 17- Ay 17- AY 17- Ay 17- 16- Q 16- 16- 16- 15- 15- 15- 15- 14- 14+ 14- 14- 200 400 600 200 400 600 200 400 6ỏ0 200 400 600 The linear correlation coefficient is r= (Round to three decimal places as needed.)arrow_forwardThe table below includes data from taxi rides. The distances are in miles, the times are in minutes, the fares are in dollars, and the tips are in dollars. Is there sufficient evidence to conclude that there is a linear correlation between the time of the ride and the tip amount? Construct a scatterplot, find the value of the linear correlation coefficient r, and find the P-value of r. Determine whether there is sufficient evidence to support a claim of linear correlation between the two variables. Use a significance level of a = 0.01. Does it appear that riders base their tips on the time of the ride? Click here for information on the taxi rides. Construct a scatterplot. Choose the correct graph below. O A. Tip Amount ($) 25- Q 0 35 G Ride time (minutes) Determine the linear correlation coefficient. The linear correlation coefficient is r= (Round to three decimal places as needed.) Tip Amount ($) B. 25- 0- 0 35 G Ride time (minutes) Taxi data ip Amount (S C. 25- 0- 35 Ride time…arrow_forward
- Listed below are amounts of court income and salaries paid to the town justices. All amounts are in thousands of dollars. Construct a scatterplot, find the value of the linear correlation coefficient r, and find the P-value using a = 0.05. Is there sufficient evidence to conclude that there is a linear correlation between court incomes and justice salaries? Based on the results, does it appear that justices might profit by levying larger fines? Court Income Justice Salary 65.0 403.0 1568.01132.0 271.0 252.0 112.0 150.0 34.0 e 60 31 42 91 57 46 24 25 17 Ο Α. Η : ρ=0, B. Ho: p=0 H:p#0 H,:p>0 O C. Ho: p=0 O D. Ho: pz0 H1:p=0 H,:p<0 Construct a scatterplot. Choose the correct graph below. O A. OB. Oc. C. D. AJustice Salary 100- Q AJustice Salary 100- AJustice Salary 100- AJustice Salary 100- Q .. 50- 50- 50- . 50- 50- . 0- 0- 0- 800 1600 800 1600 800 1600 800 1600 Court Income Court Income Court Income Court Income The linear correlation coefficient is r= 0.869 (Round to three decimal…arrow_forwardPolice sometimes measure shoe prints at crime scenes so that they can learn something about criminals. Listed below are shoe print lengths, foot lengths, and heights of males. Construct a scatterplot, find the value of the linear correlation coefficient r, and find the P-value of r. Determine whether there is sufficient evidence to support a claim of linear correlation between the two variables. Based on these results, does it appear that police can use a shoe print length to estimate the height of a male? Use a significance level of a= 0.01. Shoe Print (cm) | 28.8 Foot Length (cm) 24.8 Height (cm) 30.8 30.4 31.1 28.6 24.6 27.8 26.1 25.3 177.6 179.2 179.2 169.4 169.5arrow_forwardListed below are amounts of court income and salaries paid to the town justices. All amounts are in thousands of dollars. Construct a scatterplot, find the value of the linear correlation coefficient r, and find the P-value using a= 0.05. Is there sufficient evidence to conclude that there is a linear correlation between court incomes and justice salaries? Based on the results, does it appear that justices might profit by levying larger fines? Court Income Justice Salary 65.0 406.0 1566.0 1131.0 274.0 253.0 110.0 152.0 31.0 e 29 45 94 58 46 61 25 26 19 The linear correlation coefficient is r= (Round to three decimal places as needed.) The test statistic is t=. (Round to three decimal places as needed.) The P-value is (Round to three decimal places as needed.) V than the significance level 0.05, there court incomes and justice salaries for a significance level of a = 0.05. Because the P-value is V sufficient evidence to support the claim that there is a linear correlation between Based…arrow_forward
- Listed below are annual data for various years. The data are weights (metric tons) of imported lemons and car crash fatality rates per 100,000 population. Construct a scatterplot, find the value of the linear correlation coefficient r, and find the P-value using a = 0.05. Is there sufficient evidence to conclude that there is a linear correlation between lemon imports and crash fatality rates? Do the results suggest that imported lemons cause car fatalities? 484 534 Lemon Imports Crash Fatality Rate 229 15.8 266 15.7 359 15.5 15.3 14.8 OC. Ho: p=0 H₁: p=0 Construct a scatterplot. Choose the correct graph below. O A. Ay 17+ 16- 15- 14- 0 200 400 600 Q Q The linear correlation coefficient is r= (Round to three decimal places as needed.) The test statistic is t- (Round to three decimal places as needed.) The P-value is (Round to three decimal places as needed.) Because the P-value is OB. Ax 17+ 16- 15 14+ 6 than the significance level 0.05, there % 0 200 400 400 600 Q Q G OD. H₂:p#0 H₁:…arrow_forwardListed below are annual data for various years. The data are weights (metric tons) of imported lemons and car crash fatality rates per 100,000 population. Construct a scatterplot, find the value of the linear correlation coefficient r, and find the P-value using a = 0.05. Is there sufficient evidence to conclude that there is a linear correlation between lemon imports and crash fatality rates? Do the results suggest that imported lemons cause car fatalities? Lemon Imports Crash Fatality Rate 231 265 358 483 530 15.8 15.7 15.5 15.2 14.8 What are the null and alternative hypotheses? OA. Ho: p 0 H₁ p=0 OC. Ho p=0 H₁: p>0 Construct a scatterplot. Choose the correct graph below. OA. Ay 17- 16- Q do ° 15- ° 14+ 0 200 400 600 The linear correlation coefficient is r= (Round to three decimal places as needed.) B. Ho: p=0 H₁p 0 OD. Ho: p=0 H₁: p<0 B. COD. Ay 17- Ay 17- Ay 17+ Q о 16- 16- 16- Q 0 ° ° 15- 15- ° G 15- G 14- 14- 14+ 0 200 400 600 0 200 400 600 0 200 400 600arrow_forwardAfter gathering data about the number of starfish and measuring the pollution in areas of the ocean you find a negative linear correlation between pollution levels and number of starfish. What can you conclude based on this information? a. There is a confounding variable that is affecting both pollution and starfish. b. As pollution rises the number of starfish falls c. That pollution is causing starfish to die, leading to the negative correlation d. That pollution is supporting starfish, leading to the negative correlationarrow_forward
arrow_back_ios
SEE MORE QUESTIONS
arrow_forward_ios
Recommended textbooks for you
- MATLAB: An Introduction with ApplicationsStatisticsISBN:9781119256830Author:Amos GilatPublisher:John Wiley & Sons Inc
 Probability and Statistics for Engineering and th...StatisticsISBN:9781305251809Author:Jay L. DevorePublisher:Cengage Learning
 Statistics for The Behavioral Sciences (MindTap C...StatisticsISBN:9781305504912Author:Frederick J Gravetter, Larry B. WallnauPublisher:Cengage Learning
  Elementary Statistics: Picturing the World (7th E...StatisticsISBN:9780134683416Author:Ron Larson, Betsy FarberPublisher:PEARSON
 The Basic Practice of StatisticsStatisticsISBN:9781319042578Author:David S. Moore, William I. Notz, Michael A. FlignerPublisher:W. H. Freeman
 Introduction to the Practice of StatisticsStatisticsISBN:9781319013387Author:David S. Moore, George P. McCabe, Bruce A. CraigPublisher:W. H. Freeman
MATLAB: An Introduction with Applications
Statistics
ISBN:9781119256830
Author:Amos Gilat
Publisher:John Wiley & Sons Inc
Probability and Statistics for Engineering and th...
Statistics
ISBN:9781305251809
Author:Jay L. Devore
Publisher:Cengage Learning
Statistics for The Behavioral Sciences (MindTap C...
Statistics
ISBN:9781305504912
Author:Frederick J Gravetter, Larry B. Wallnau
Publisher:Cengage Learning
Elementary Statistics: Picturing the World (7th E...
Statistics
ISBN:9780134683416
Author:Ron Larson, Betsy Farber
Publisher:PEARSON
The Basic Practice of Statistics
Statistics
ISBN:9781319042578
Author:David S. Moore, William I. Notz, Michael A. Fligner
Publisher:W. H. Freeman
Introduction to the Practice of Statistics
Statistics
ISBN:9781319013387
Author:David S. Moore, George P. McCabe, Bruce A. Craig
Publisher:W. H. Freeman