
MATLAB: An Introduction with Applications
6th Edition
ISBN: 9781119256830
Author: Amos Gilat
Publisher: John Wiley & Sons Inc
expand_more
expand_more
format_list_bulleted
Related questions
Question
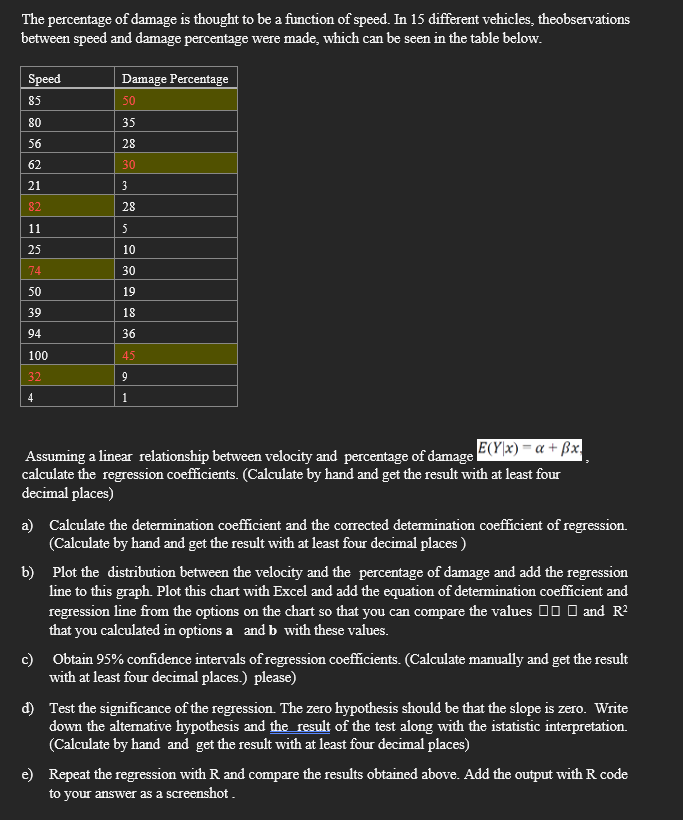

Transcribed Image Text:The percentage of damage is thought to be a function of speed. In 15 different vehicles, theobservations
between speed and damage percentage were made, which can be seen in the table below.
Speed
Damage Percentage
85
50
80
35
56
28
62
30
21
3
82
28
11
5
25
10
74
30
50
19
39
18
94
36
100
45
32
9
4
1
Assuming a linear relationship between velocity and percentage of damage E(Y\x) = a + ßx.
calculate the regression coefficients. (Calculate by hand and get the result with at least four
decimal places)
a) Calculate the determination coefficient and the corrected determination coefficient of regression.
(Calculate by hand and get the result with at least four decimal places)
b) Plot the distribution between the velocity and the percentage of damage and add the regression
line to this graph. Plot this chart with Excel and add the equation of determination coefficient and
regression line from the options on the chart so that you can compare the values
that you calculated in options a and b with these values.
and R²
c) Obtain 95% confidence intervals of regression coefficients. (Calculate manually and get the result
with at least four decimal places.) please)
d) Test the significance of the regression. The zero hypothesis should be that the slope is zero. Write
down the alternative hypothesis and the result of the test along with the istatistic interpretation.
(Calculate by hand and get the result with at least four decimal places)
e) Repeat the regression with R and compare the results obtained above. Add the output with R code
to your answer as a screenshot
Expert Solution
This question has been solved!
Explore an expertly crafted, step-by-step solution for a thorough understanding of key concepts.

Step by stepSolved in 5 steps with 1 images

Knowledge Booster

Similar questions
- Indiana's DOT announces a goal to reduce their motor vehicle death rate so that it is proportional to Illinois. How many deaths would Indiana be able to have to achieve this goal... Indiana deaths...693...populatin...6 million Illinois deaths...911...population...12.4 millionarrow_forwardSee below.arrow_forwardRadon is a gas emitted from the ground that can collect in houses in buildings. At certain levels it can cause lung cancer. Radon concentrations are measured in picocuries per liter (pCi/L). A radon level of 4 pCi/L is considered “acceptable” Radon levels in a house vary from week to week. In one house, a sample of 6 weeks had the following readings for radon level (in pCi/L): 1.9 2.8 3.9 3.9 4.2 5.7 Find the variance and standard deviation (definitional formula). Show your work using a table.arrow_forward
- In the table below is a column of masses for various individuals. 20 Kg (kllograms), for instance, is a typical mass for a young child while 80 kg Is characteristic of an adult's mass, If you were to travel to the Moon, your weight would change but your mass would remain the same. Roughly speaking, mass is a measure of the amount of "stuff" you're made of (matter). In the United States we commonly measure weight using the English pound. Another common unit for measuring weight is the Newton. The second column in the table shows the corresponding weight, in Newtons, for each individual. These are the weights on Earth. Plot each pair of numbers as an ordered pair on the graph. Use the vertical ("y") axis for the weights and the horizontal ("x") axis for mass. Label your axes. Draw a best fit line through the points and measure the slope of this line. On your plot, mark and circle the points you use to determine the slope. The slope gives you the "weight per unit mass" here on Earth. In…arrow_forwardPlease label each partarrow_forwardAt the stadium, there are three lines for arriving customers, each staffed by a single worker. The arrival rate for customers is 140 per minute and each customer takes (on average) 1.1 seconds for a worker to process. The coefficient of variation for arrival time is 1.4 and the coefficient of variation for service time is 1. (Round your answerto three decimal places.) How much time (in seconds will an average customer spend in queue? secondsarrow_forward
- You are interested in the relationship between gender and violent victimization. You have the data below: Victimization No Yes Total Gender b. Interpret Lambda. Male 150 50 200 Female 190 10 200 Total 340 60 400 a. Calculate Lambda. If needed, take a picture of your work and insert directly into the workspace.arrow_forwardAn agricultural experimenter divided a tract of land into seven plots of equal size. Each plot was treated with different levels of fertilizer to determine whether the level of fertilizer application affects yield. The results are shown below: Plot F 5.5 Level of Fertilizer, X Yleld (in Ibs), Y 3.0 3.5 4.0 4.5 5.0 6.0 53 57 56 58 62 59 63 What is the simple power equation for the given pairs of data? OY = 1.6266X^0.0216 OY = 0.2109X^0.0216 OY = 1.6266X^0.2155 %3D OY- 0.2109X^0.2155 O none of the abovearrow_forwardYou Got Gas have developed a new type of fuel additive that supposedly increases car speed. Before they put it out on the market, however, they need to test if it really is a difference compared to standard fuel. So, they took 6 vehicles and calculated the time it takes to for them to drive 1 mile going as fast as they can. They received the following data: Car ID# Course time (standard fuel in minutes) Course time (w/ additive in minutes) 1 35 27 2 40 35 3 25 27 4 40 39 5 95 94 6 32 18 6. What is the null and research hypothesis for this study? 7. What type of statistical test should we use to compare means (z-test, independent t-test, dependent t-test, or ANOVA)? Why? 8. What are the degrees of freedom? What are the critical values for that statistical test with this data at α = 0.05? α = 0.01? 9. Comparing the groups, is there a significant difference at α = 0.05 in lap time between eating the name bran and when they ate Dog Go? 10. How would the researcher…arrow_forward
arrow_back_ios
arrow_forward_ios
Recommended textbooks for you
- MATLAB: An Introduction with ApplicationsStatisticsISBN:9781119256830Author:Amos GilatPublisher:John Wiley & Sons Inc
 Probability and Statistics for Engineering and th...StatisticsISBN:9781305251809Author:Jay L. DevorePublisher:Cengage Learning
 Statistics for The Behavioral Sciences (MindTap C...StatisticsISBN:9781305504912Author:Frederick J Gravetter, Larry B. WallnauPublisher:Cengage Learning
  Elementary Statistics: Picturing the World (7th E...StatisticsISBN:9780134683416Author:Ron Larson, Betsy FarberPublisher:PEARSON
 The Basic Practice of StatisticsStatisticsISBN:9781319042578Author:David S. Moore, William I. Notz, Michael A. FlignerPublisher:W. H. Freeman
 Introduction to the Practice of StatisticsStatisticsISBN:9781319013387Author:David S. Moore, George P. McCabe, Bruce A. CraigPublisher:W. H. Freeman
MATLAB: An Introduction with Applications
Statistics
ISBN:9781119256830
Author:Amos Gilat
Publisher:John Wiley & Sons Inc
Probability and Statistics for Engineering and th...
Statistics
ISBN:9781305251809
Author:Jay L. Devore
Publisher:Cengage Learning
Statistics for The Behavioral Sciences (MindTap C...
Statistics
ISBN:9781305504912
Author:Frederick J Gravetter, Larry B. Wallnau
Publisher:Cengage Learning
Elementary Statistics: Picturing the World (7th E...
Statistics
ISBN:9780134683416
Author:Ron Larson, Betsy Farber
Publisher:PEARSON
The Basic Practice of Statistics
Statistics
ISBN:9781319042578
Author:David S. Moore, William I. Notz, Michael A. Fligner
Publisher:W. H. Freeman
Introduction to the Practice of Statistics
Statistics
ISBN:9781319013387
Author:David S. Moore, George P. McCabe, Bruce A. Craig
Publisher:W. H. Freeman