MATLAB: An Introduction with Applications
6th Edition
ISBN: 9781119256830
Author: Amos Gilat
Publisher: John Wiley & Sons Inc
expand_more
expand_more
format_list_bulleted
Concept explainers
Question

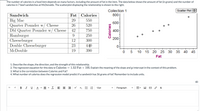
Transcribed Image Text:The number of calories in a food item depends on many factors, including the amount of fat in the item. The data below shows the amount of fat (in grams) and the number of
calories in 7 beef sandwiches at McDonalds. The scatterplot displaying the relationship is shown to the right.
Collection 1
Scatter Plot
Sandwich
Fat Calories
800-
Big Mac
Quarter Pounder w/ Cheese
Dbl Quarter Pounder w/ Cheese
Hamburger
Cheeseburger
Double Cheeseburger
29
550
600-
26
520
42
750
400-
9.
250
200-
12
300
23
440
McDouble
19
390
10 15 20 25 30
35 40 45
Fat
1. Describe the shape, the direction, and the strength of this relationship.
2. The regression equation for this data is Calories
1.52 Fat + 105. Explain the meaning of the slope and y-intercept in the context of this problem.
3. What is the correlation between Calories and Fat?
4. What number of calories does the regression model predict if a sandwich has 36 grams of fat? Remember to include units.
B I U A
Ix E E E
x X, = E
12pt
Paragraph
Calories
囲
Expert Solution
This question has been solved!
Explore an expertly crafted, step-by-step solution for a thorough understanding of key concepts.
This is a popular solution
Trending nowThis is a popular solution!
Step by stepSolved in 3 steps with 1 images

Knowledge Booster
Learn more about
Need a deep-dive on the concept behind this application? Look no further. Learn more about this topic, statistics and related others by exploring similar questions and additional content below.Similar questions
- Given the data set : 7,19,8,1,30,43,14,6,40 Identify the flowing values that would be used when creating the box plot Highest: Upper quartile: Median : Lower quartile: Lowestarrow_forwardThe Big Mac index is a way of measuring Purchasing Power Parity (PPP) between different countries. By diverting the average national Big Mac prices to U.S. dollars, the same goods can be informally compared. The Big Mac can also be a good indicator for the individual purchasing power of an economy since he exists worldwide in standard size, composition and quality. Price # of Countries Rel. f. Cum. f 1.50-1.99 2 2.00-2.49 4 2.50-2.99 7 3.00-3.49 9 3.50-3.99 7 4.00-4.49 8 4.50-4.99 9 5.00-5.49 7 5.50-5.99 1 6.00-6.49 2 6.50-6.99 1arrow_forwardUse this data which give the dosage levels for a particular drug and the heart rate measured 30 minutes after taking the drug. Dose (mg) Heart rate 0.125 95 0.20 90 0.25 93 0.30 92 0.35 88 0.40 80 0.50 82 Create a scatter plot. Use your Ti-84arrow_forward
- Bianca is a swimmer training for a competition. The number of 50-metre laps she swam each day for 30 days are as follows: 22, 21, 24, 19, 27, 28, 24, 25, 29, 28, 26, 31, 28, 27, 22, 39, 20, 10, 26, 24, 27, 28, 26, 28, 18, 32, 29, 25, 31, 27.Draw the stem and leaf plot by splitting the stems into five-unit intervals. Explain what the plot shows.arrow_forwardThe data in the picture contains purchase data for golf purchases. Create a doughnut chart in Excel to compare the purchases by gender each year with the US population. Below the chart, explain what it illustrates.arrow_forwardFor each type of chart determine the type of variable that should be usedarrow_forward
- Graph the data in a scatter diagram: Age Calories 765 1520 15 2540 500 5. 795 17 2350 6. 1900 Use the paperclip button below to attach files. XDG BIUに ..arrow_forwardWhat is the variable being examined for individuals in the population(s)? Amount of alcohol consumed by each person per year. Average number of Americans who consume alcohol. Amount of alcohol sold per year. Whether or not a person consumes alcohol. info: The average American consumes 100 liters of alcohol per year. Does the average college student consume less alcohol per year? A researcher surveyed 13 randomly selected college students and found that they averaged 85.7 liters of alcohol consumed per year with a standard deviation of 21 liters.arrow_forwardplease answer 8d, e, and f.arrow_forward
arrow_back_ios
arrow_forward_ios
Recommended textbooks for you
 MATLAB: An Introduction with ApplicationsStatisticsISBN:9781119256830Author:Amos GilatPublisher:John Wiley & Sons Inc
 Probability and Statistics for Engineering and th...StatisticsISBN:9781305251809Author:Jay L. DevorePublisher:Cengage Learning
 Statistics for The Behavioral Sciences (MindTap C...StatisticsISBN:9781305504912Author:Frederick J Gravetter, Larry B. WallnauPublisher:Cengage Learning
 Elementary Statistics: Picturing the World (7th E...StatisticsISBN:9780134683416Author:Ron Larson, Betsy FarberPublisher:PEARSON
 The Basic Practice of StatisticsStatisticsISBN:9781319042578Author:David S. Moore, William I. Notz, Michael A. FlignerPublisher:W. H. Freeman
 Introduction to the Practice of StatisticsStatisticsISBN:9781319013387Author:David S. Moore, George P. McCabe, Bruce A. CraigPublisher:W. H. Freeman

MATLAB: An Introduction with Applications
Statistics
ISBN:9781119256830
Author:Amos Gilat
Publisher:John Wiley & Sons Inc

Probability and Statistics for Engineering and th...
Statistics
ISBN:9781305251809
Author:Jay L. Devore
Publisher:Cengage Learning

Statistics for The Behavioral Sciences (MindTap C...
Statistics
ISBN:9781305504912
Author:Frederick J Gravetter, Larry B. Wallnau
Publisher:Cengage Learning

Elementary Statistics: Picturing the World (7th E...
Statistics
ISBN:9780134683416
Author:Ron Larson, Betsy Farber
Publisher:PEARSON

The Basic Practice of Statistics
Statistics
ISBN:9781319042578
Author:David S. Moore, William I. Notz, Michael A. Fligner
Publisher:W. H. Freeman

Introduction to the Practice of Statistics
Statistics
ISBN:9781319013387
Author:David S. Moore, George P. McCabe, Bruce A. Craig
Publisher:W. H. Freeman