MATLAB: An Introduction with Applications
6th Edition
ISBN: 9781119256830
Author: Amos Gilat
Publisher: John Wiley & Sons Inc
expand_more
expand_more
format_list_bulleted
Question

Transcribed Image Text:**Testing the Mean of Differences for Paired Data**
To test the claim about the mean of the differences for a population of paired data at the specified level of significance (\(\alpha\)), assume the samples are random and dependent, and the populations are normally distributed.
**Claim:** \(\mu_d \geq 0\)
**Level of Significance:** \(\alpha = 0.10\)
**Sample Statistics:**
- Mean of differences (\(\bar{d}\)) = -2.4
- Standard deviation of differences (\(s_d\)) = 1.4
- Sample size (\(n\)) = 14
**Hypothesis Options:**
A.
- \(H_0: \mu_d < 0\)
- \(H_a: \mu_d \geq 0\)
B.
- \(H_0: \mu_d \geq 0\)
- \(H_a: \mu_d < 0\)
C.
- \(H_0: \mu_d \leq 0\)
- \(H_a: \mu_d > 0\)
D.
- \(H_0: \mu_d = 0\)
- \(H_a: \mu_d \neq 0\)
E.
- \(H_0: \mu_d = 0\)
- \(H_a: \mu_d > 0\)
F.
- \(H_0: \mu_d = 0\)
- \(H_a: \mu_d \neq 0\)
**Explanation:**
This test involves determining if the mean difference (\(\mu_d\)) is significantly different from the hypothesized claim (\(\geq\) 0). Each option presents a set of null (\(H_0\)) and alternative (\(H_a\)) hypotheses, allowing for different possibilities based on the claim being tested.
Choose the correct hypothesis set that aligns with evaluating whether the mean of the differences is greater than or equal to zero.

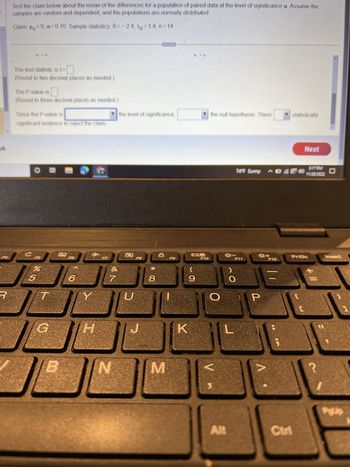
Transcribed Image Text:### Hypothesis Testing for Paired Data
**Claim: μ₀ ≥ 0; α = 0.10. Sample statistics:**
- \( \bar{d} = -2.4 \)
- \( s_d = 1.4 \)
- n = 14
**Test the Claim:**
This section guides you through evaluating the mean differences for a population of paired data at the given significance level (α = 0.10). It assumes random and dependent samples with normally distributed populations.
1. **Test Statistic:**
- Calculate the test statistic \( t \) using the given sample statistics. (Round to two decimal places as needed.)
2. **P-Value:**
- Determine the P-value associated with the test statistic. (Round to three decimal places as needed.)
3. **Decision Making:**
- Compare the P-value with the level of significance (α).
- If the P-value is less than α, reject the null hypothesis.
- Make a conclusion based on statistical evidence.
This setup helps in understanding hypothesis testing scenarios dealing with paired samples. To complete these steps, use standard formulas for hypothesis tests involving means of paired data.
Expert Solution
This question has been solved!
Explore an expertly crafted, step-by-step solution for a thorough understanding of key concepts.
This is a popular solution
Trending nowThis is a popular solution!
Step by stepSolved in 2 steps

Knowledge Booster
Similar questions
- No Excelarrow_forwardAssume the population is normally distributedarrow_forwardYou are testing the claim that the mean GPA of night students is different from the mean GPA of day students. A sample of 24 night students and 28 day students and their GPA's are recorded below. Test the claim using a 1% level of significance. Assume the population variances are unequal and that GPAs are normally distributed. Give answers to 4 decimal places. GPA-Night GPA-Day 3.05 3.38 2.91 3.02 3.27 3.4 3.29 2.73 3.3 3.24 3.35 2.69 3.39 3.25 3.52 3.33 3.39 2.33 3.25 3.51 3.08 3.07 3.27 2.9 3.32 3.48 3 2.94 3.62 2.93 3.64 3.31 3.54 2.62 3.45 2.66 3.29 3.27 3.56 2.76 3.15 2.7 3.4 3.27 3.51 2.96 3.54 2.86 3.24 2.72 2.64 3.14 What are the correct hypotheses? Note this may view better in full screen mode. Select the correct symbols in the order they appear in the problem.H0: Select an answer x̅₂ s² x̅₁ σ² μ₂ μ₁ p ? = ≠ > < ≥ ≤ Select an answer 0 μ₂ x̅₂ x̅₁ σ² p s² μ₁ H1: Select an answer σ² x̅₂ x̅₁ μ₁ μ₂…arrow_forward
- Assume that you want to test the claim that the paired smaple data come from a population for which the mean difference is population mean d=0. Compute the value of the t test statistic. Round intermediate calculations to four decimal places as need and final answers to three decimal places as needed x 9 6 7 5 12 y 6 8 3 6 7arrow_forwardImage has all the dataarrow_forwardIn the US, 46.2% of all people have type O blood, 39.1% have type A blood, 10.4% have type B blood and 4.3% have type AB blood. A researcher wants to see if the distribution of blood type is different for millionaires. The table below shows the results of a random sample of 3116 millionaires. What can be concluded at the a = 0.01 significance level? a. Complete the table by filling in the expected frequencies. Round to the nearest whole number: Frequencies of Blood Type Outcome Frequency Expected Frequency 1434 A 1224 В 310 AB 148 b. What is the correct statistical test to use? Select an answer V c. What are the null and alternative hypotheses? Но: O Blood type and income are independent. O The distribution of blood type for millionaires is not the same as it is for Americans in general. O The distribution of blood type for millionaires is the same as it is for Americans in general. O Blood type and income are dependent.arrow_forward
- We give the total variation, the unexplained variation (SSE), and the least squares point estimate b1 . Total variation = 13.459; SSE = 2.806; b1 = 2.6652 Click here for the Excel Data File Using the information given, find the explained variation, the simple coefficient of determination (r2), and the simple correlation coefficient (r). Interpret r2. (Round your answers to 3 decimal places. Round your percent to 1 decimal place.) Explained variation r2 r % of the variation in demand can be explained by variation in price differential.arrow_forwardA product is designed to have length of 14cm+/0.12cm. the output of the manufacturing process is identified to be centered at 14.0.042cm and the standard deviation is estimated at 0.014cm. determine the capability of the system Cparrow_forwardUsing this data set What is the standard error of the relevant distribution? Ignoring that the number of men in the 2012 Survey was about 17,675, and the number of women was about 18,634, assume the samples were 100 men and 100 women in each Survey My worked solution is: P1: men proportion change = 15.5/100 = 0.155 N1 = 100 P2: women proportion change = 57.9/100 = 0.579 N2 = 100 {[0.155 * (1 - 0.155) /] + [0.579 * (1 - 0.579) / 100]} = 0.0037 Standard Error = 0.0037 is this correct?arrow_forward
arrow_back_ios
arrow_forward_ios
Recommended textbooks for you
 MATLAB: An Introduction with ApplicationsStatisticsISBN:9781119256830Author:Amos GilatPublisher:John Wiley & Sons Inc
 Probability and Statistics for Engineering and th...StatisticsISBN:9781305251809Author:Jay L. DevorePublisher:Cengage Learning
 Statistics for The Behavioral Sciences (MindTap C...StatisticsISBN:9781305504912Author:Frederick J Gravetter, Larry B. WallnauPublisher:Cengage Learning
 Elementary Statistics: Picturing the World (7th E...StatisticsISBN:9780134683416Author:Ron Larson, Betsy FarberPublisher:PEARSON
 The Basic Practice of StatisticsStatisticsISBN:9781319042578Author:David S. Moore, William I. Notz, Michael A. FlignerPublisher:W. H. Freeman
 Introduction to the Practice of StatisticsStatisticsISBN:9781319013387Author:David S. Moore, George P. McCabe, Bruce A. CraigPublisher:W. H. Freeman

MATLAB: An Introduction with Applications
Statistics
ISBN:9781119256830
Author:Amos Gilat
Publisher:John Wiley & Sons Inc

Probability and Statistics for Engineering and th...
Statistics
ISBN:9781305251809
Author:Jay L. Devore
Publisher:Cengage Learning

Statistics for The Behavioral Sciences (MindTap C...
Statistics
ISBN:9781305504912
Author:Frederick J Gravetter, Larry B. Wallnau
Publisher:Cengage Learning

Elementary Statistics: Picturing the World (7th E...
Statistics
ISBN:9780134683416
Author:Ron Larson, Betsy Farber
Publisher:PEARSON

The Basic Practice of Statistics
Statistics
ISBN:9781319042578
Author:David S. Moore, William I. Notz, Michael A. Fligner
Publisher:W. H. Freeman

Introduction to the Practice of Statistics
Statistics
ISBN:9781319013387
Author:David S. Moore, George P. McCabe, Bruce A. Craig
Publisher:W. H. Freeman