
MATLAB: An Introduction with Applications
6th Edition
ISBN: 9781119256830
Author: Amos Gilat
Publisher: John Wiley & Sons Inc
expand_more
expand_more
format_list_bulleted
Related questions
Concept explainers
Question

Transcribed Image Text:The National Weather Service says that the mean daily high temperature
for October in a large mid-western city is 56°F. A local weather service
suspects that this value is not accurate and wants to perform a hypothesis
test to determine whether the mean is actually lower than 56°F. A sample
of mean daily high temperatures for October over the past 37 years yields
a sample mean of 54° F. Assume that the population standard deviation is
5.6° F. Perform the hypothesis test at the 1% significance level.
STEP 1. Ho: H
o H: H
NOTE: For enter /=
STEP 2. This test is (e) left-tailed, (f) two-tailed or (g) right-tailed test.
This test is
(enter e, f or g)
STEP 3. The critical value (s) is
Use the following chart to identify the critical value (s)
Left-tailed
Two-tailed
Right tailed
R=10%
7= -1.28 (AL
T1 65 (RI
voBook
E3
To home
no end
m pgup
F12 Padn
pi se
3
4
5
6
7
8
9
E
R
Y
U
Expert Solution
This question has been solved!
Explore an expertly crafted, step-by-step solution for a thorough understanding of key concepts.

Step by stepSolved in 2 steps

Knowledge Booster


Learn more about
Need a deep-dive on the concept behind this application? Look no further. Learn more about this topic, statistics and related others by exploring similar questions and additional content below.Similar questions
- The speed of cars driving past Johnson City High School, on 666 Reynolds Rd, were recorded over one school year. The speed limit on that part of Reynolds Rd is 20 mph. The mean of the speed readings was 24.19 mph, with a standard deviation of 3.56 mph.arrow_forwardOn a standardized exam, the scores are normally distributed with a mean of 350 and a standard deviation of 20. Find the z-score of a person who scored 400 on the exam.arrow_forwardIn the 1800s, German physician Carl Reinhold, took millions of axillary (i.e. armpit) temperatures from soldiers. This study established that body temperature is normally distributed and the standard normal human body temperature is 98.6°F with a standard deviation of 0.72 °F. In a recent study, American researchers obtained 5,000 axillary temperatures from a Los Angeles hospital. The mean of these temperature readings was 97.9 °F. Assuming a Type I error risk of no more than 5%, did the findings support the theory that human, body temperature has decreased since the 1800s? What is the Z crit?arrow_forward
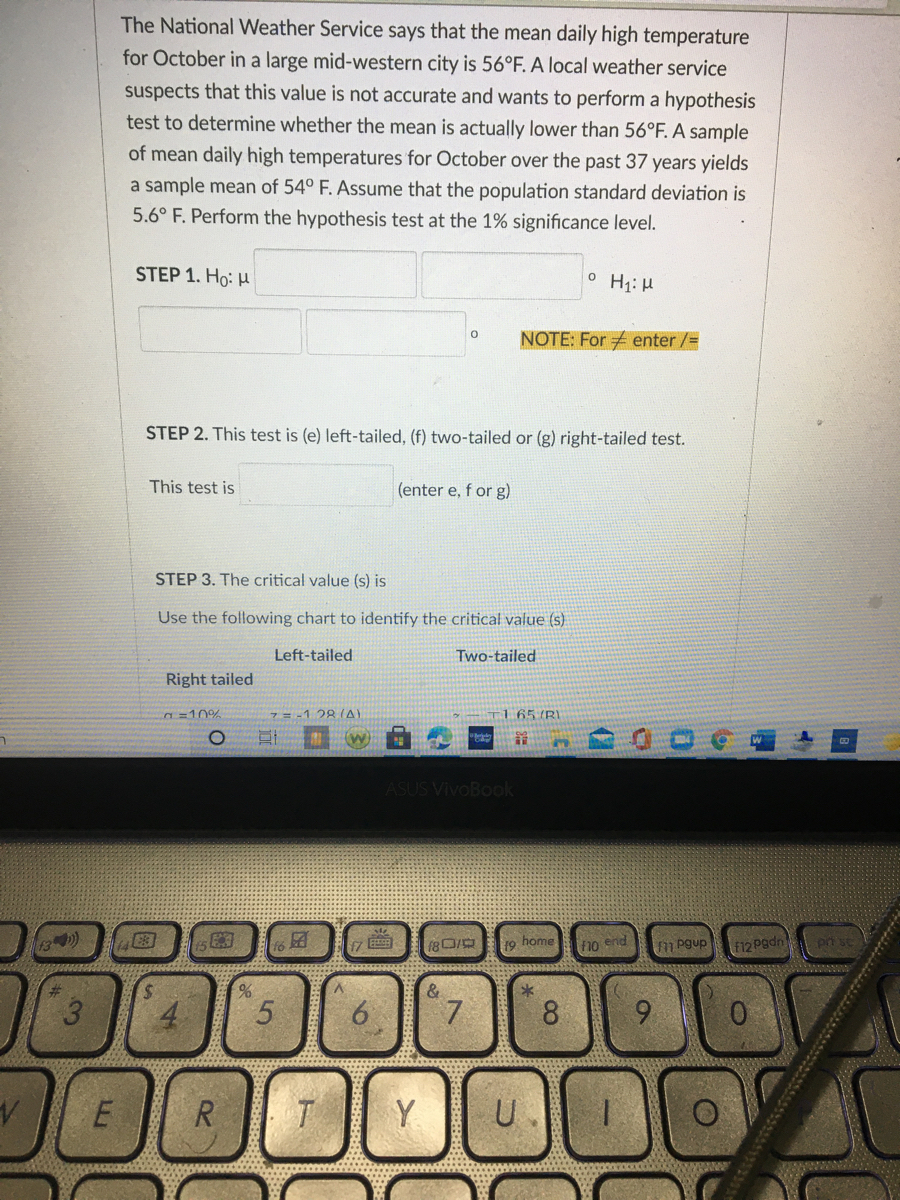
- To compare the dry braking distances from 30 to 0 miles per hour for two makes of automobiles, a safety engineer conducts braking tests for 35 models of Make A and 35 models of Make B. The mean braking distance for Make A is 40 feet. Assume the population standard deviation is 4.9 feet. The mean braking distance for Make B is 44 feet. Assume the population standard deviation is 4.6 feet. At a = 0.10, can the engineer support the claim that the mean braking distances are different for the two makes of automobiles? Assume the samples are random and independent, and the populations are normally distributed. Complete parts (a) through (e). Click here to view page 1 of the standard normal distribution table. Click here to view page 2 of the standard normal distribution table. (a) Identify the claim and state H, and Ha. What is the claim? A. The mean braking distance is different for the two makes of automobiles. B. The mean braking distance is less for Make A automobiles than Make B…arrow_forwardTo compare the dry braking distances from 30 to 0 miles per hour for two makes of automobiles, a safety engineer conducts braking tests for 35 models of Make A and 35 models of Make B. The mean braking distance for Make A is 42 feet. Assume the population standard deviation is 4.7 feet. The mean braking distance for Make B is 45 feet. Assume the population standard deviation is 4.4 feet. At a = 0.10, can the engineer support the claim that the mean braking distances are different for the two makes of automobiles? Assume the samples are random and independent, and the populations are normally distributed. Complete parts (a) rari rz (b) Find the critical value(s) and identify the rejection region(s). The critical value(s) is/are (Round to three decimal places as needed. Use a comma to separate answers as needed.)arrow_forwardThe National Weather Service says that the mean daily high temperature for October in a large mid-western city is 56°F. A local weather service suspects that this value is not accurate and wants to perform a hypothesis test to determine whether the mean is actually lower than 56°F. A sample of mean daily high temperatures for October over the past 37 years yields a sample mean of 54o F. Assume that the population standard deviation is 5.6° F. Perform the hypothesis test at the 1% significance level. STEP 1. H0: µ:____ ______o _____: H1: µ ____ o NOTE: For ≠ enter /= STEP 2. This test is (e) left-tailed, (f) two-tailed or (g) right-tailed test. This test is:___ (enter e, f or g) STEP 3. The critical value (s) is Use the following chart to identify the critical value (s) Left-tailed Two-tailed Right tailed α =10% z = -1.28 (A) z=∓1.65 (B)…arrow_forward
- The distribution of the student heights at a large college is approximately bell shaped. If the mean height is 66 inches,and approximately 95% of the heights fall between 32 and 100 inches, then, the standard deviation of the heightdistribution is approximately equal toarrow_forwardPyramid Lake is on the Paiute Indian Reservation in Nevada. The lake is famous for cutthroat trout. Suppose a friend tells you that the average length of trout caught in Pyramid Lake isμ=19 inches. However, a survey reported that of a simple random sample of 38 fish caught, the mean length was 19.9 inches, with estimated standard deviation of 3.1 inches. Do these data indicate that the average length of a trout caught in Pyramid Lake is different from μ=19inches? Use α=0.001. What is the value of the test statistic? (Round your answer to two decimal places.)Find the P-value. (Round your answer to four decimal places.)arrow_forwardThe Weather Underground reported that the mean amount of summer rainfall for the northeastern US is at least 11.52 inches. Ten cities in the northeast are randomly selected and the mean rainfall amount is calculated to be 7.42 inches with a standard deviation of 1.3 inches. At the α = 0.05 level, can it be concluded that the mean rainfall was below the reported average? What if α = 0.01? Assume the amount of summer rainfall follows a normal distribution. Please also state if the assumption of normal distribution was essential for solving this question. You will need to specify the appropriate hypothesis, identify the statistical test, estimate p-value (using R command), and state your conclusion in the context of the problem. For the conclusion, please use the following template. If you reject the null writeSince p-value is [write the value of your p-value] and is less than [write the value of alpha inpercent] we reject the null hypothesis at [write the value of alpha]% significance…arrow_forward
arrow_back_ios
arrow_forward_ios
Recommended textbooks for you
- MATLAB: An Introduction with ApplicationsStatisticsISBN:9781119256830Author:Amos GilatPublisher:John Wiley & Sons Inc
 Probability and Statistics for Engineering and th...StatisticsISBN:9781305251809Author:Jay L. DevorePublisher:Cengage Learning
 Statistics for The Behavioral Sciences (MindTap C...StatisticsISBN:9781305504912Author:Frederick J Gravetter, Larry B. WallnauPublisher:Cengage Learning
  Elementary Statistics: Picturing the World (7th E...StatisticsISBN:9780134683416Author:Ron Larson, Betsy FarberPublisher:PEARSON
 The Basic Practice of StatisticsStatisticsISBN:9781319042578Author:David S. Moore, William I. Notz, Michael A. FlignerPublisher:W. H. Freeman
 Introduction to the Practice of StatisticsStatisticsISBN:9781319013387Author:David S. Moore, George P. McCabe, Bruce A. CraigPublisher:W. H. Freeman
MATLAB: An Introduction with Applications
Statistics
ISBN:9781119256830
Author:Amos Gilat
Publisher:John Wiley & Sons Inc
Probability and Statistics for Engineering and th...
Statistics
ISBN:9781305251809
Author:Jay L. Devore
Publisher:Cengage Learning
Statistics for The Behavioral Sciences (MindTap C...
Statistics
ISBN:9781305504912
Author:Frederick J Gravetter, Larry B. Wallnau
Publisher:Cengage Learning
Elementary Statistics: Picturing the World (7th E...
Statistics
ISBN:9780134683416
Author:Ron Larson, Betsy Farber
Publisher:PEARSON
The Basic Practice of Statistics
Statistics
ISBN:9781319042578
Author:David S. Moore, William I. Notz, Michael A. Fligner
Publisher:W. H. Freeman
Introduction to the Practice of Statistics
Statistics
ISBN:9781319013387
Author:David S. Moore, George P. McCabe, Bruce A. Craig
Publisher:W. H. Freeman