
MATLAB: An Introduction with Applications
6th Edition
ISBN: 9781119256830
Author: Amos Gilat
Publisher: John Wiley & Sons Inc
expand_more
expand_more
format_list_bulleted
Related questions
Question
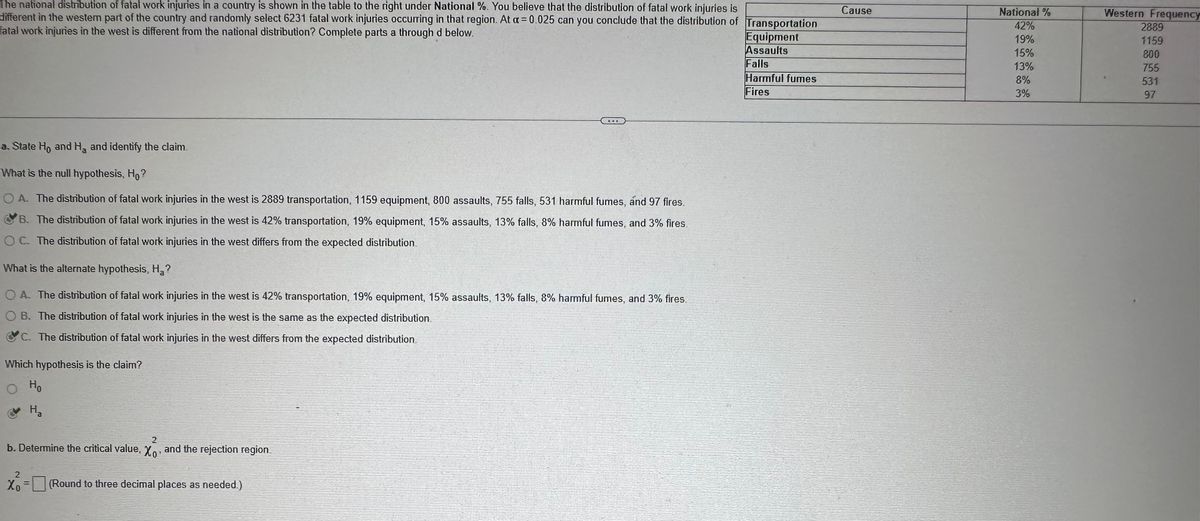

Transcribed Image Text:The national distribution of fatal work injuries in a country is shown in the table to the right under National %. You believe that the distribution of fatal work injuries is
different in the western part of the country and randomly select 6231 fatal work injuries occurring in that region. At a = 0.025 can you conclude that the distribution of Transportation
fatal work injuries in the west is different from the national distribution? Complete parts a through d below.
a. State Ho and H. and identify the claim.
What is the null hypothesis, Ho?
OA. The distribution of fatal work injuries in the west is 2889 transportation, 1159 equipment, 800 assaults, 755 falls, 531 harmful fumes, and 97 fires.
B. The distribution of fatal work injuries in the west is 42% transportation, 19% equipment, 15% assaults, 13% falls, 8% harmful fumes, and 3% fires.
OC. The distribution of fatal work injuries in the west differs from the expected distribution.
What is the alternate hypothesis, H₂?
O A. The distribution of fatal work injuries in the west is 42% transportation, 19% equipment, 15% assaults, 13% falls, 8% harmful fumes, and 3% fires.
OB. The distribution of fatal work injuries in the west is the same as the expected distribution.
C. The distribution of fatal work injuries in the west differs from the expected distribution
Which hypothesis is the claim?
O Ho
H₂
a
2
b. Determine the critical value, Xo
1
2
Xo
=
=
and the rejection region
MAP
(Round to three decimal places as needed.)
Equipment
Assaults
Falls
Harmful fumes
Fires
Cause
National %
42%
19%
15%
13%
8%
3%
Western Frequency
2889
1159
800
755
531
97
Expert Solution
This question has been solved!
Explore an expertly crafted, step-by-step solution for a thorough understanding of key concepts.

Step by stepSolved in 4 steps with 28 images

Knowledge Booster

Similar questions
- A researcher would like to know whether there is a consistent, predictable relationship between ACT scores and GPA for high school students. A sample of 100 students is obtained from students who took the ACT in their Junior year. Based on the test results and gpa scores, students are classified as high or low for ACT and for GPA. The results are summarized in the following frequency distribution: ACT Score High Low High GPA 39 21 Low GPA 15 25 Based on the data, is there a significant relationship between ACT scores and GPA (α = .05). Compute the appropriate measure of association.arrow_forward3. The blood types of 20 patients are listed below: B B AB A B AB B A Construct a categorical frequency distribution. (Fill in the table below). AAarrow_forward2. The salaries (in millions of dollars) for 31 NFL teams for a specific season are given in this frequency distribution. Construct a histogram and a frequency polygon on the same graph for the data. Comment on the shape of the distribution. Class boundaries Frequency 39.5 – 42.5 42.5 – 45.5 2 45.5 – 48.5 5 48.5 – 51.5 5 51.5 – 54.5 12 54.5 – 57.5 5arrow_forward
- In the frequency distribution of 100 families given below, the number of families corresponding to expenditure groups 20-40 and 60–80 are missing from the table. However, the median is known to be 50. Find the missing frequencies. Expenditure 0-20 20-40 40-60 60-80 80–100 No. of families 14 ? 27 ? 15arrow_forwardQuestion c. Find the percentage of these adults who possess 7 or fewer credit cards. d. Draw an ogive for the cumulative percentage distribution. e. Using the ogive, find the percentage of adults who possess 10 or fewer credit cards.arrow_forwardPlease answer question 11.5arrow_forward
- When 30 randomly selected customers left a convenience store, each was asked the number of items he or she purchased. Construct an ungrouped frequency distribution for the data. 2 10 5 4 7 6 3 9 7 6 7 6 4 9 7 6 3 4 3 5 6 10 10 9 10 4 3 2 8 5arrow_forward2. A smartphone manufacturer is advertising that its new smartphone has the best battery life. Thirty smartphones were randomly selected and the number of hours each smartphone lasted before reaching 0% battery is recorded below. A. Using the following distribution of battery life (in hours) of the latest new smartphone, construct a box & whisker plot on the graph paper and display the 5-number summary on the boxplot. BATTERY LIFE (IN NUMBER OF HOURS) 50, 25, 39, 37, 49, 48, 62, 44, 41, 34, 38, 39, 40, 49, 32, 36, 44, 49, 47, 44, 49, 46, 39, 38, 44, 45, 50, 43, 40, 42 (Σx- 1283 md Σχ 56261 ) B. State the 5-Number Summary: Min: Lower Quartile: Median: Upper Quartile: Мах: C. State the shape of the Box Plot. D. What does the shape of the Box Plot indicate about the battery lives of the new smartphone? E. Using the modified box plot function of your TI Calculator modified box plot, determine if there are any outliers or potential outliers. If outlier(s) exist, then state the value of the…arrow_forwardThe national distribution of fatal work injuries in a country is shown in the table to the right under National %. You believe that the distribution of fatal work injuries is different in the western part of the country and randomly select 6231 fatal work injuries occurring in that region. At alpha equals 0.10 can you conclude that the distribution of fatal work injuries in the west is different from the national distribution? Complete parts a through d below. Cause National % Western Frequency Transportation 42 % 2894 Equipment 17 % 1158 Assaults 15 % 805 Falls 14 % 751 Harmful fumes 9 % 535 Fires 3 % 88 a. State Upper H 0 and Upper H Subscript a and identify the claim. What is the null hypothesis, Upper H 0 ? A. The distribution of fatal work injuries in the west is 2894 transportation,…arrow_forward
- Construct a frequency bar graph. Congestive heart failure Coronary atherosclerosis Heart attack Infant birth Pneumonia 0 0 A 0 A A 100 200 Frequency 300 400arrow_forwardThe national distribution of fatal work injuries in a country is shown in the table to the right under National %. You believe that the distribution of fatal work injuries is different in the western part of the country and randomly select 6231 fatal work injuries occurring in that region. At a = 0.05 National % 42% Western Frequency 2893 Cause Transportation can you conclude that the distribution of fatal work injuries in the west is different from the national distribution? Complete parts a through d below. Equipment Assaults Falls Harmful fumes 19% 1157 14% 806 13% 753 10% 532 Fires 2% 90 a. State Ho and H and identify the claim. What is the null hypothesis, Ho? O A. The distribution of fatal work injuries in the west is 42% transportation, 19% equipment, 14% assaults, 13% falls, 10% harmful fumes, and 2% fires O B. The distribution of fatal work injuries in the west differs from the expected distribution. O C. The distribution of fatal work injuries in the west is 2893…arrow_forwardWhen 30 randomly selected customers left a convenience store, each was asked the number of items he or she purchased. Construct an ungrouped frequency distribution for the data. Create a histogram for the data in #7. Create a frequency polygon for the data in #7. 2 10 5 4 7 6 3 9 7 6 7 6 4 9 7 6 3 4 3 5 6 10 10 9 10 4 3 2 8 5arrow_forward
arrow_back_ios
SEE MORE QUESTIONS
arrow_forward_ios
Recommended textbooks for you
- MATLAB: An Introduction with ApplicationsStatisticsISBN:9781119256830Author:Amos GilatPublisher:John Wiley & Sons Inc
 Probability and Statistics for Engineering and th...StatisticsISBN:9781305251809Author:Jay L. DevorePublisher:Cengage Learning
 Statistics for The Behavioral Sciences (MindTap C...StatisticsISBN:9781305504912Author:Frederick J Gravetter, Larry B. WallnauPublisher:Cengage Learning
  Elementary Statistics: Picturing the World (7th E...StatisticsISBN:9780134683416Author:Ron Larson, Betsy FarberPublisher:PEARSON
 The Basic Practice of StatisticsStatisticsISBN:9781319042578Author:David S. Moore, William I. Notz, Michael A. FlignerPublisher:W. H. Freeman
 Introduction to the Practice of StatisticsStatisticsISBN:9781319013387Author:David S. Moore, George P. McCabe, Bruce A. CraigPublisher:W. H. Freeman
MATLAB: An Introduction with Applications
Statistics
ISBN:9781119256830
Author:Amos Gilat
Publisher:John Wiley & Sons Inc
Probability and Statistics for Engineering and th...
Statistics
ISBN:9781305251809
Author:Jay L. Devore
Publisher:Cengage Learning
Statistics for The Behavioral Sciences (MindTap C...
Statistics
ISBN:9781305504912
Author:Frederick J Gravetter, Larry B. Wallnau
Publisher:Cengage Learning
Elementary Statistics: Picturing the World (7th E...
Statistics
ISBN:9780134683416
Author:Ron Larson, Betsy Farber
Publisher:PEARSON
The Basic Practice of Statistics
Statistics
ISBN:9781319042578
Author:David S. Moore, William I. Notz, Michael A. Fligner
Publisher:W. H. Freeman
Introduction to the Practice of Statistics
Statistics
ISBN:9781319013387
Author:David S. Moore, George P. McCabe, Bruce A. Craig
Publisher:W. H. Freeman