
A First Course in Probability (10th Edition)
10th Edition
ISBN: 9780134753119
Author: Sheldon Ross
Publisher: PEARSON
expand_more
expand_more
format_list_bulleted
Related questions
Concept explainers
Topic Video
Question
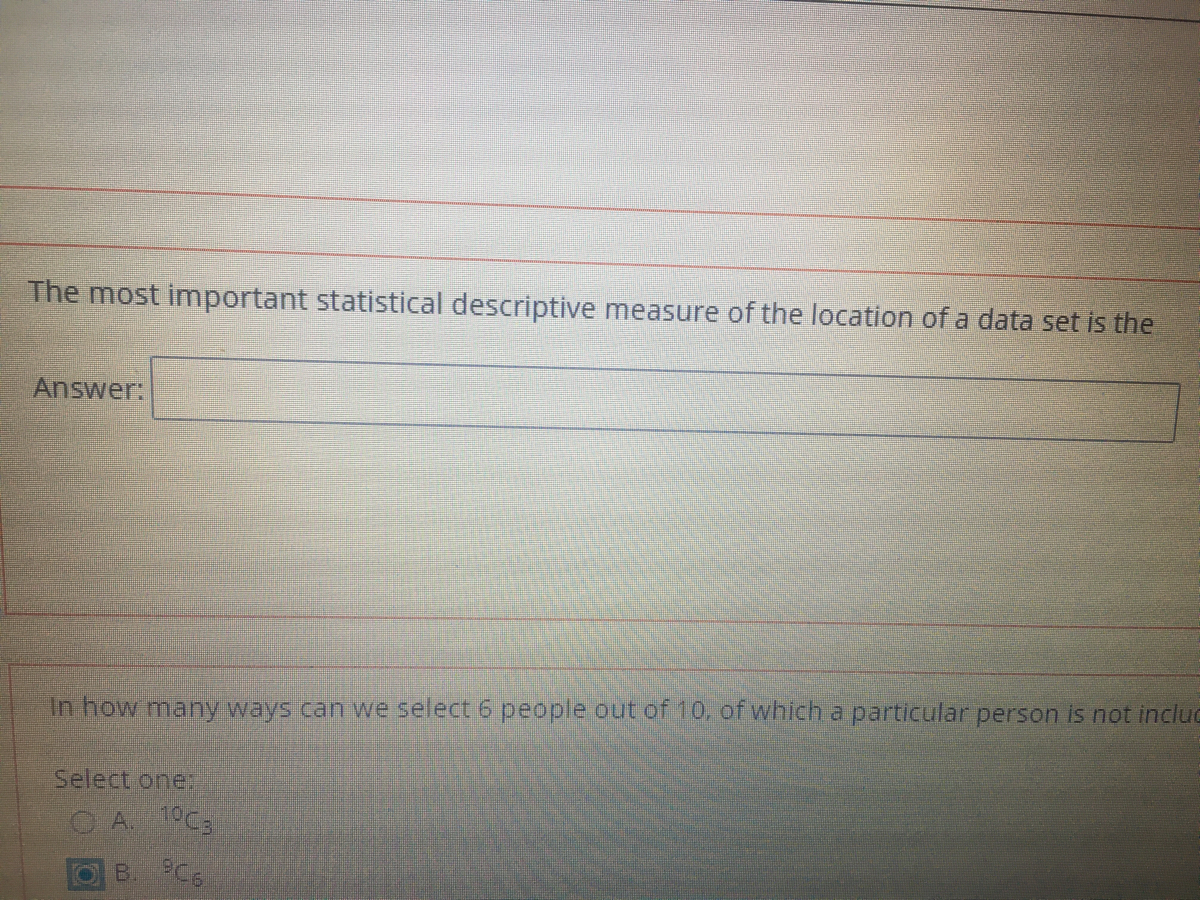

Transcribed Image Text:The most important statistical descriptive measure of the location of a data set is the
Answer:
In how many ways can we select 6 people out of 10, of which a particular person is not incluc
Select one:
CA.1C
OBC
Expert Solution
This question has been solved!
Explore an expertly crafted, step-by-step solution for a thorough understanding of key concepts.

This is a popular solution

Trending nowThis is a popular solution!

Step by stepSolved in 2 steps with 1 images

Knowledge Booster


Learn more about
Need a deep-dive on the concept behind this application? Look no further. Learn more about this topic, probability and related others by exploring similar questions and additional content below.Similar questions
- In the class poll from the beginning of the year, you were asked what color car you drive. The results are summarized below. aqua 3 beige/tan/gold 39 black 80 blue 44 green 21 orange 3 pink 1 purple 3 red 45 silver 63 white 74 yellow 1 What is the mode for this data set?arrow_forwardDrop down options are as follows: a. z test or t test b. u or p, <,>,= or not equal to c. z or tarrow_forwardUse the following information for the question. A group of home gardeners want to test whether the type of soil used to grow heirloom tomatoes has an effect on the number of tomatoes harvested. Gardeners randomly assigned tomato plants to be grown in soil with no fertilizer, commercial plant food, and homemade compost. All other growing conditions were kept the same. Forty plants were assigned to each group. At the end of the growing season the number of tomatoes harvested was counted. Assume that all other conditions for the ANOVA test have been met. One-way ANOVA F=0.762135 P=0.5202354 Factor df-2 SS=710.349206 MS=355.174603 Using the test results provided, test the hypothesis that soil treatment affects the number of tomatoes harvested. Use a significance level of 5%. Choose the correct decision regarding the null hypothesis and correct conclusion. O Reject Ho. We can conclude that the treatment of the soil affects the number of heirloom tomatoes harvested. O Reject Ho- We can…arrow_forward
- Adela Noriegam, a researcher wants to determine how employee salaries at a certain company are related to the length of employment, previous experience, and education. The researcher selects eight employees from the company and obtains the following data: Employee Salary,y Employment (in yrs), x1 Employment (in yrs), x2 Employment (in yrs), x3 A 57310 10 2 16 B 57380 5 6 16 C 54135 4 1 12 D 56985 6 5 14 E 58715 8 8 16 F 60000 20 0 12 G 59400 9 4 18 H 60720 15 7 17 What is the regression equation? Leave your answer in 2 decimal places Y = ()+() +() +arrow_forwardVirginia polled a large sample of individuals to find the percentage of students with known food allergies and the percentage of students without known food allergies. Which of the following could sufficiently display the data if only the two given categories are to be included? Select the correct answer below: bar graph pie chart either a pie chart or a bar graph neither a pie chart nor a bar grapharrow_forwardThe following data represent the responses to two questions asked in a survey of 10 college students majoring in business-What is your gender? (male = M; female = F) and What is your major? (accounting = A; computer information systems = C; marketing = M). Complete parts (a) and (b). м м M A C Gender: F F M F M Major: M A A A a. Tally the data into a contingency table where the two rows represent the gender categories and the three columns represent the academic-major categories. Student Major Categories Gender A Totals Male 3 6 Female 1 2 4 Totals 4 4 10 b. Construct contingency tables based on percentages of all 10 student responses, based on row percentages and based on column percentages. Complete the following contingency table based on total percentages. Student Major Categories Gender A M Totals Male 30.00 10.00 20.00 60.00 Female 10.00 10.00 20.00 40.00 Totals 40.00 20.00 40.00 100.00 (Round to two decimal places as needed.) Complete the following contingency table based on row…arrow_forward
- Use the following information for the question. A group of home gardeners want to test whether the type of soil used to grow heirloom tomatoes has an effect on the number of tomatoes harvested. Gardeners randomly assigned tomato plants to be grown in soil with no fertilizer, commercial plant food, and homemade compost. All other growing conditions were kept the same. Forty plants were assigned to each group. At the end of the growing season the number of tomatoes harvested was counted. Assume that all other conditions for the ANOVA test have been met.State the null and alternative hypothesis.arrow_forwardPaul Consultancy took a random sample of the monthly office rents per square meter and the percentage of vacancy office space in fifteen different cities. The results are shown in the table: (Use 3 decimal places) Vacancy rate Monthly rent 15 8000 12 7500 11 5300 8 6200 6 4500 10 5000 9 6000 9 6500 12 7000 20 10000 21 9500 15 9000 8 7500 9 8800 20 11000 Determine the following: a: ? b: ? r: ? r2: ? MS regression: ? MS residual: ? F ratio: ? F0.05: ?arrow_forwardA college student is interested in whether presoaking time has an effect on cleanliness of clothing. He collects the dirty clothes from all of the people in his dorm and randomly assigns clothing to one of four presoak time conditions: 5 minutes, 10 minutes, 15 minutes, 20 minutes. He then asks members of another dorm to rate the cleanliness of the items (they don’t know which clothing got which soaking time). The data are presented below. C) Perform an LSD test and answer the questions that follow (SHOW ALL WORK!!! This can be on the same page as your other ANOVA hand work. Make sure it is inserted and/or uploaded): df error = tcrit (df error) MS error = s = LSD = _____________ Mean Comparisons: Mean5 min vs. Mean10 min = | ___ __ | = ___ ___ Greater than (>) LSD value? __ ___ Significant?__ ___ Mean10 min vs. Mean15 min = |__________________| = ______ Greater…arrow_forward
- Dr. Smith conducts research concerning the association between deception and trust of other individuals. She recruits six subjects to take part in their study. Each subject is also asked to "list the number of times you have lied in the past week," as a measure of deception. Also, each subject is asked, "on a scale of 1 to 7 (1 being none and 7 being a lot) how much do you trust individuals?" Here is the data: Ps Deception (X) 1 2 13 st 15 16 |4 3 7 2 5 H₁: | 13 The research hypothesis is that there is an association between deception and trust of people. ♦ Step 1. Express the substantive question as two statistical hypotheses. Ho: ◄► Trust (Y) 14 14 13 ♦ (O ◆ 6 13 14arrow_forwardThe director of student services at Oxnard College is interested in whether women are less likely to attend orlentation than men before they begin their coursework. A random sample of freshmen at Oxnard College were asked what their gender is and whether they attended orientation. The results of the survey are shown below: Data for Gender vs. Orlentation Attendance Women Men Yes 426 491 No 190 189 What can be concluded at the a = 0.10 level of significance? For this study, we should use Select an answer a. The null and alternative hypotheses would be: Ho: Select an answery Select an answerv Select an answerv (please enter a decimal and note that p1 and ul represent the proportion and mean for women and p2 and u2 represent the proportion and mean for men.) H: Select an answerv Select an answerv Select an answerv (Please enter a decimal) b. The test statistic ?v = (please show your answer to 3 decímal places.) c. The p-value = (Please show your answer to 4 decimal places.) d. The p-value…arrow_forwardA foundation asked each person in a representative sample of high school students and in a representative sample of high school teachers which of the rights guaranteed by the First Amendment they thought was the most important. Suppose that the sample size for each sample was 1,000. Data consistent with summary values from the study are summarized in the accompanying table. Students = Teachers Freedom of Speech 658 400 USE SALT Most Important First Amendment Right Freedom of Religion Freedom to Peacefully Assemble Freedom of the Press 30 55 245 420 20 55 Freedom to Petition the Government 47 70 (a) Carry out a hypothesis test to determine if there is convincing evidence that the proportions falling into the five First Amendment rights categories are not the same for teachers and students. Use a significance level of a = 0.01. Calculate the test statistic. (Round your answer to two decimal places.) x²= Use technology to calculate the P-value. (Round your answer to four decimal places.)…arrow_forward
arrow_back_ios
SEE MORE QUESTIONS
arrow_forward_ios
Recommended textbooks for you
- A First Course in Probability (10th Edition)ProbabilityISBN:9780134753119Author:Sheldon RossPublisher:PEARSON

A First Course in Probability (10th Edition)
Probability
ISBN:9780134753119
Author:Sheldon Ross
Publisher:PEARSON