MATLAB: An Introduction with Applications
6th Edition
ISBN: 9781119256830
Author: Amos Gilat
Publisher: John Wiley & Sons Inc
expand_more
expand_more
format_list_bulleted
Topic Video
Question

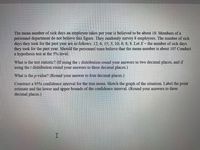
Transcribed Image Text:The mean number of sick days an employee takes per year is believed to be about 10. Members of a
personnel department do not believe this figure. They randomly survey &8 employees. The number of sick
days they took for the past year are as follows: 12; 6; 15; 3; 10; 8; 8; 8. Let X= the number of sick days
they took for the past year. Should the personnel team believe that the mean number is about 10? Conduct
a hypothesis test at the 5% level.
What is the test statistic? (If using the z distribution round your answers to two decimal places, and if
using the t distribution round your answers to three decimal places.)
What is the p-value? (Round your answer to four decimal places.)
Construct a 95% confidence interval for the true mean. Sketch the graph of the situation. Label the point
estimate and the lower and upper bounds of the confidence interval. (Round your answers to three
decimal places.)
Expert Solution
arrow_forward
Step 1
Let denotes the population mean number of sick days an employee takes per year. The test is that the personnel team believe that the mean number is about 10 or not. The hypothesis is,
Null hypothesis:
Alternative hypothesis:
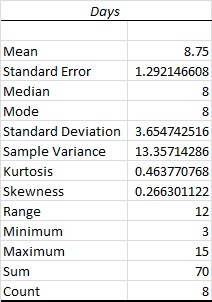
The descriptive statistics is conducted using EXCEL. The software procedure is given below:
- Enter the data.
- Select Data > Data Analysis >Descriptive Statistics> OK.
- Enter Input Range as Days column.
- Mark Labels in First Row.
- Mark Summary Statistics.
- Click OK.
The output using EXCEL is as follows:

From the output, the mean is 8.75, and the standard deviation is 3.6547.
The test statistic is,
Thus, the test statistic is -0.967.
Trending nowThis is a popular solution!
Step by stepSolved in 3 steps with 2 images

Knowledge Booster
Learn more about
Need a deep-dive on the concept behind this application? Look no further. Learn more about this topic, statistics and related others by exploring similar questions and additional content below.Similar questions
- n a city with three high schools, all the ninth graders took a Standardized Test, with these results: High School Mean score on test Number of ninth graders Glenwood 78 280 Central City 92 328 Lincoln High 73 159 The city's PR manager, who never took statistics, claimed the mean score of all ninth graders in the city was 81 . Of course, that is incorrect. What is the mean score for all ninth graders in the city? Round to one decimal place.arrow_forwardA marketing firm is doing research for an Internet-based company. It wants to appeal to the age group of people who spend the most money online. The company wants to know if there is a difference in the mean amount of money people spend per month on Internet purchases depending on their age bracket. The marketing firm looked at two age groups, 18-24 years and 25-30 years, and collected the data shown in the following table. Let Population 1 be the amount of money spent per month on Internet purchases by people in the 18-24 age bracket and Population 2 be the amount of money spent per month on Internet purchases by people in the 25-30 age bracket. Assume that the population variances are not the same. Internet Spending per Month 18-24 Years 25-30 Years Mean Amount Spent 55.19 65.24 Standard Deviation Sample Size 11.39 13.68 21 25 Step 1 of 2: Construct a 90 % confidence interval for the true difference between the mean amounts of money per month that people in these two age groups spend…arrow_forwardIn a city with three high schools, all the ninth graders took a Standardized Test, with these results: High School Mean score on test Number of ninth graders Glenwood 81 261 Central City 93 338 Lincoln High 67 189 The city's PR manager, who never took statistics, claimed the mean score of all ninth graders in the city was 80.3. Of course, that is incorrect. What is the mean score for all ninth graders in the city? Round to one decimal place. mean of all ninth grader's scores =arrow_forward
- Which of the following is the best measure of central tendency for race? Mode:1 Mean:1.32 Median:1arrow_forwardUse the following information to answer the question. A researcher wants to study whether there is a relationship between car color and whether the driver received a speeding ticket. The observed frequency table is below. What is the alternative hypothesis? Group of answer choices A. Red cars average more speeding tickets than all other cars. B. Red cars average fewer speeding tickets than all other cars. C. There is no relationship between car color and whether the driver received a speeding ticket. D. There is a relationship between car color and whether the driver received a speeding ticket.arrow_forwardThe owner of Maumee Ford-Volvo wants to study the relationship between the age of a car and its selling price. Listed below is a random sample of 12 used cars sold at the dealership during the last year. Complete the chart and the question below. Car Age (years) Selling Price ($000) 1 9 8.1 2 7 6.0 3 11 3.6 4 12 4.0 5 8 5.0 6 7 10.0 7 8 7.6 8 11 8.0 9 10 8.0 10 12 6.0 11 6 8.6 12 6 8.0 Determine the coefficient of determination: ________________arrow_forward
- Records from the Washington Department of Licensing show that 47 former SFCC business students have incorporated their own businesses in the last five years. Eight of these students are selected at random and contacted. Each is asked how many people are employed by their corporation. The responses are: 7, 12, 13, 17, 10, 5, 10, and 6 employees. What is your best estimate of the mean number of employees for all 47 corporations?arrow_forward5. For 2019, the mean fare to fly from Los Angeles to Miami was $250 on Aero Lindvallia. In December 2021, nine flights were randomly surveyed resulting in the following ticket price data being recorded: $ 321 $ 280 24 $ 286 $ 299 $310 $ 275 $ 250 $ 270 $ 281 The numbers above can be copied & pasted directly into Microsoft Excel®. a. What test would you use to determine if the ticket prices had gone up or down? Is it a one-tailed or two-tailed test? Explain. b. Calculate the necessary statistics to perform that test. c. Using the 6-step hypothesis testing procedure, perform the test that you described above. Use a level of significance of 0.01. Comment on each step of the 6-step hypothesis testing procedure; especially explain why a t-distribution must be used. d. Compute the p-value. Would the results of the hypothesis test change if the level of significance was 0.05? se ecA uarrow_forwardSuppose you want to estimate the percentage of videos on YouTube that are cat videos. It is impossible for you to watch all videos on YouTube so you use a random video picker to select 1000 videos for you. You find that 2% of these videos are cat videos. A. What is the sample? B. Label each of the following as an observational unit, a variable, a statistic, or a parameter i. Percentage of all videos on YouTube that are cat videos. ii. 2% iii. A video in your sample. iv. The proportion of videos in your sample that are cat videos.arrow_forward
- For one study, researchers sampled over 100,000 first-time candidates for the certified public accountant (CPA) exam and recorded the total semester hours of college credit for each candidate. The mean and median for the data set were 137.56 and 143 hours, respectively. E Interpret the median. PO in O A. The sum of all the candidates' credit hours divided by the total number of candidates is equal to 143 hours. B. The most frequent number of semester hours a candidate reported is 143 hours. O C. Half the candidates had more than 143 credit hours and half the candidates had less than 143 credit hours.arrow_forwardIn a city with three high schools, all the ninth graders took a Standardized Test, with these results: Highschool Mean score of test number of 9th grades Glenwood 81 275 Central City 95 338 Lincoln High 66 172 The city's PR manager, who never took statistics, claimed the mean score of all ninth graders in the city was 83 . Of course, that is incorrect. What is the mean score for all ninth graders in the city? Round to one decimal place. mean of all ninth grader's scores =arrow_forwardThe lifetime of a light bulb is normally distributed with an average life of 500 hours and a standard deviation of 100 hours. If a company installs 5000 of these light bulbs, find the number of bulbs that can be expected to last between 500 hours and 675 hours.arrow_forward
arrow_back_ios
SEE MORE QUESTIONS
arrow_forward_ios
Recommended textbooks for you
 MATLAB: An Introduction with ApplicationsStatisticsISBN:9781119256830Author:Amos GilatPublisher:John Wiley & Sons Inc
 Probability and Statistics for Engineering and th...StatisticsISBN:9781305251809Author:Jay L. DevorePublisher:Cengage Learning
 Statistics for The Behavioral Sciences (MindTap C...StatisticsISBN:9781305504912Author:Frederick J Gravetter, Larry B. WallnauPublisher:Cengage Learning
 Elementary Statistics: Picturing the World (7th E...StatisticsISBN:9780134683416Author:Ron Larson, Betsy FarberPublisher:PEARSON
 The Basic Practice of StatisticsStatisticsISBN:9781319042578Author:David S. Moore, William I. Notz, Michael A. FlignerPublisher:W. H. Freeman
 Introduction to the Practice of StatisticsStatisticsISBN:9781319013387Author:David S. Moore, George P. McCabe, Bruce A. CraigPublisher:W. H. Freeman

MATLAB: An Introduction with Applications
Statistics
ISBN:9781119256830
Author:Amos Gilat
Publisher:John Wiley & Sons Inc

Probability and Statistics for Engineering and th...
Statistics
ISBN:9781305251809
Author:Jay L. Devore
Publisher:Cengage Learning

Statistics for The Behavioral Sciences (MindTap C...
Statistics
ISBN:9781305504912
Author:Frederick J Gravetter, Larry B. Wallnau
Publisher:Cengage Learning

Elementary Statistics: Picturing the World (7th E...
Statistics
ISBN:9780134683416
Author:Ron Larson, Betsy Farber
Publisher:PEARSON

The Basic Practice of Statistics
Statistics
ISBN:9781319042578
Author:David S. Moore, William I. Notz, Michael A. Fligner
Publisher:W. H. Freeman

Introduction to the Practice of Statistics
Statistics
ISBN:9781319013387
Author:David S. Moore, George P. McCabe, Bruce A. Craig
Publisher:W. H. Freeman