The
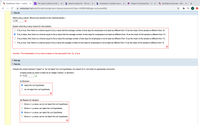
1). What is the P value?
Explain what the p-value means for this problem.
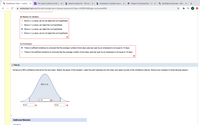
2). Construct a 95% confidence interval for the true mean. Sketch the graph of the situation. Label the point estimate and the lower and upper bounds of the confidence interval. (Round your answers to three decimal places.)


Trending nowThis is a popular solution!
Step by stepSolved in 6 steps with 7 images

- Indicate whether each of the given statements could apply to a dataset consisting of 500 different values. a. The 20th percentile is less than the 30th b. The median is greater than the first quartile. c. The mean is equal to the mode. d. The range is less than zero. e. There are multiple means.arrow_forwardThe mean number of sick days an employee takes per year is believed to be about 10. Members of a personnel department do not believe this figure. They randomly survey &8 employees. The number of sick days they took for the past year are as follows: 12; 6; 15; 3; 10; 8; 8; 8. Let X= the number of sick days they took for the past year. Should the personnel team believe that the mean number is about 10? Conduct a hypothesis test at the 5% level. What is the test statistic? (If using the z distribution round your answers to two decimal places, and if using the t distribution round your answers to three decimal places.) What is the p-value? (Round your answer to four decimal places.) Construct a 95% confidence interval for the true mean. Sketch the graph of the situation. Label the point estimate and the lower and upper bounds of the confidence interval. (Round your answers to three decimal places.)arrow_forwardOnly letters C and Darrow_forward
- A violin student records the number of hours she spends practicing during each of nine consecutive weeks: 6.2 5.0 4.3 7.4 5.8 7.2 8.4 1.2 6.3 What is the mean number of hours spent practicing per week during this period? a. 6.20 hours b. 6.15 hours c. 8.40 hours d. 5.76 hoursarrow_forwardThe mean number of sick days an employee takes per year is believed to be about 10. Members of a personnel department do not believe this figure. They randomly survey 8 employees. The number of sick days they took for the past year are as follows: 10; 5; 13; 3; 11; 8; 6; 9. Let X = the number of sick days they took for the past year. Should the personnel team believe that the mean number is about 10? Conduct a hypothesis test at the 5% level.Note: If you are using a Student's t-distribution for the problem, you may assume that the underlying population is normally distributed. (In general, you must first prove that assumption, though.) What is the test statistic? (If using the z distribution round your answers to two decimal places, and if using the t distribution round your answers to three decimal places.) t = Construct a 95% confidence interval for the true mean. Sketch the graph of the situation. Label the point estimate and the lower and upper bounds of the confidence…arrow_forwardIf you have a known value of 16, which of the following is the best average of your data to verify the known value? O 12.5 + 6.02 O 16 + 3.03 O 14.2 + 2.03 O 14.2 + 3.6arrow_forward
- UBS Wealth Management UK periodically ask their customers to evaluate their financial consultants and services. The higher the customer rating, the better the perceived service. The maximum rating is 7. Independent samples of two financial consultants are given below. Consultant A has 10 years' experience, Consultant B has 1 years' experience. Use α = 0.05 and test to see whether the consultant with more experience has the higher population mean service rating. Consultant A Consultant B N1 = 16 N2 = 10 Mean1 = 6.82 Mean2 = 6.25 S1= 0.64 S2 = 0.75 State the null and alternative hypothesis, Compute the value of the test statistic. What is the p-value? What is your conclusion?arrow_forwardThe average house has 14 paintings on its walls. Is the mean larger for houses owned by teachers? The data show the results of a survey of 14 teachers who were asked how many paintings they have in their houses. Assume that the distribution of the population is normal. 15, 13, 16, 16, 17, 14, 14, 15, 13, 13, 15, 16, 15, 16 What can be concluded at the a = 0.01 level of significance? a. For this study, we should use Select an answer b. The null and alternative hypotheses would be: Но: ? Select an answer v H: ?v Select an answer v c. The test statistic ? v = (please show your answer to 3 decimal places.) d. The p-value = (Please show your answer to 4 decimal places.) e. The p-value is ? va f. Based on this, we should Select an answer v the null hypothesis. g. Thus, the final conclusion is that ... O The data suggest that the population mean number of paintings that are in teachers' houses is not significantly more than 14 at a = 0.01, so there is insufficient evidence to conclude that…arrow_forwardA consumer magazine wants to compare lifetimes of ballpoint pens of three different types. The magazine takes a random sample of pens of each time and records the lifetimes (in minutes) in the table below. Do the data indicate that there is a difference in the mean lifetime for the three brands of ballpoint pens? Brand 1 Brand 2 Brand 3 260 181 238 218 240 257 184 162 241 219 218 213arrow_forward
- 11. A manager of a department times how many hours each person works within her department. 43 42 24 50 41 28 47 47 39 59 29 31 39 42 What is the mean and median of the data? Group of answer choices Mean = 40.1; Median = 41.5 Mean = 40.0; Median = 42.5 Mean = 40; Median = 42 Mean = 40.8; Median = 47arrow_forwardThe mean number of sick days an employee takes per year is believed to be about 10.5. Members of a personnel department do not believe this figure. They randomly survey ten employees. The number of sick days they took for the past year are as follows: 12; 4; 15; 3; 11; 8; 6; 8; 2; 9. Let x = the number of sick days they took for the past year. Should the personnel team believe that the mean number is ten?arrow_forwardA researcher is looking at the relationship between rates of lung cancer and smoking status. they collect a group of smokers and non-smokers and record a binary measurement of whether or not the person has or has had lung cancer. Which statistical method should be used to test the relationship between these two variables?arrow_forward
 MATLAB: An Introduction with ApplicationsStatisticsISBN:9781119256830Author:Amos GilatPublisher:John Wiley & Sons Inc
 Probability and Statistics for Engineering and th...StatisticsISBN:9781305251809Author:Jay L. DevorePublisher:Cengage Learning
 Statistics for The Behavioral Sciences (MindTap C...StatisticsISBN:9781305504912Author:Frederick J Gravetter, Larry B. WallnauPublisher:Cengage Learning
 Elementary Statistics: Picturing the World (7th E...StatisticsISBN:9780134683416Author:Ron Larson, Betsy FarberPublisher:PEARSON
 The Basic Practice of StatisticsStatisticsISBN:9781319042578Author:David S. Moore, William I. Notz, Michael A. FlignerPublisher:W. H. Freeman
 Introduction to the Practice of StatisticsStatisticsISBN:9781319013387Author:David S. Moore, George P. McCabe, Bruce A. CraigPublisher:W. H. Freeman


