
MATLAB: An Introduction with Applications
6th Edition
ISBN: 9781119256830
Author: Amos Gilat
Publisher: John Wiley & Sons Inc
expand_more
expand_more
format_list_bulleted
Related questions
Question
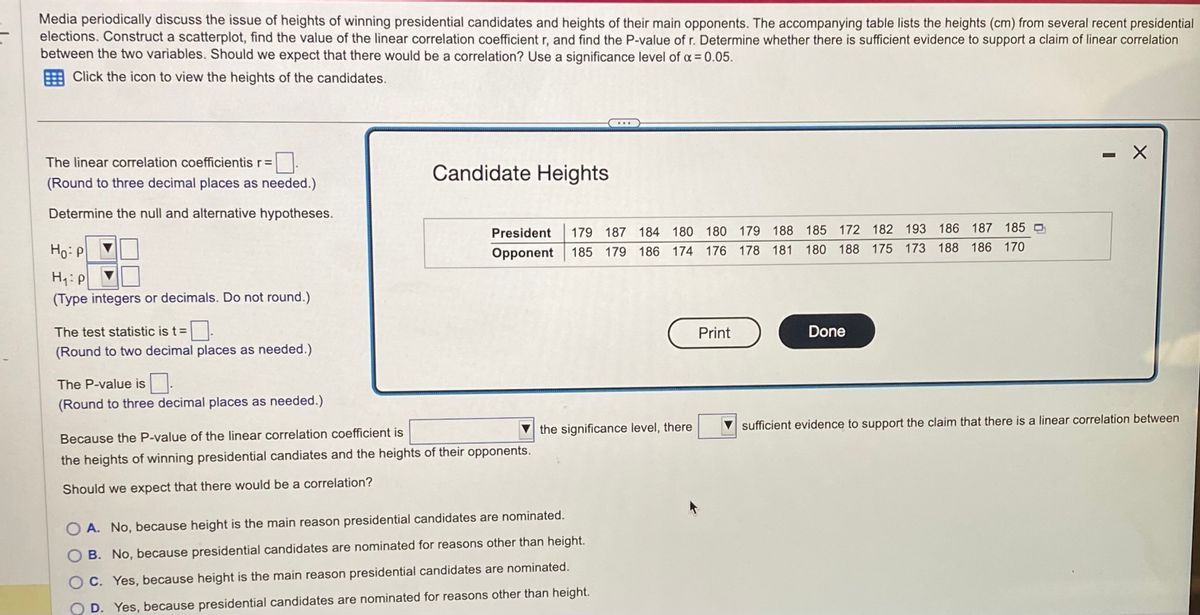

Transcribed Image Text:Media periodically discuss the issue of heights of winning presidential candidates and heights of their main opponents. The accompanying table lists the heights (cm) from several recent presidential
elections. Construct a scatterplot, find the value of the linear correlation coefficient r, and find the P-value of r. Determine whether there is sufficient evidence to support a claim of linear correlation
between the two variables. Should we expect that there would be a correlation? Use a significance level of α = 0.05.
Click the icon to view the heights of the candidates.
The linear correlation coefficientis r =
(Round to three decimal places as needed.)
Determine the null and alternative hypotheses.
Ho: P
H₁: p
(Type integers or decimals. Do not round.)
The test statistic is t =
(Round to two decimal places as needed.)
The P-value is
(Round to three decimal places as needed.)
Candidate Heights
President 179 187 184 180 180 179 188 185 172 182 193 186 187 185
Opponent 185 179 186 174 176 178 181 180 188 175 173 188 186 170
Because the P-value of the linear correlation coefficient is
the heights of winning presidential candiates and the heights of their opponents.
Should we expect that there would be a correlation?
...
the significance level, there
OA. No, because height is the main reason presidential candidates are nominated.
OB. No, because presidential candidates are nominated for reasons other than height.
C. Yes, because height is the main reason presidential candidates are nominated.
D. Yes, because presidential candidates are nominated for reasons other than height.
Print
Done
X
sufficient evidence to support the claim that there is a linear correlation between
Expert Solution
This question has been solved!
Explore an expertly crafted, step-by-step solution for a thorough understanding of key concepts.

Step by stepSolved in 3 steps with 12 images

Knowledge Booster

Similar questions
- Weight (lbs.) 173 184 194 214 168 220 188 188 207 167 217 Systolic Blood Pressure 132 143 153 162 154 168 137 149 159 128 1 1. The sample correlation coefficient is _____________arrow_forwardp16 need help parts B,F, G pleasearrow_forwardFirst Paired Data Set 4 10 13 11 19 21 36. Use the First Paired Data Set. Find the correlation coefficient r. A. 0.862 B. 0.943 C. 0.725 D. 0.607arrow_forward
- he data show the chest size and weight of several bears. Find the regression equation, letting chest size be the independent (x) variable. Then find the best predicted weight of a bear with a chest size of 51 inches. Is the result close to the actual weight of 4 punds? Use a significance level of 0.05. thest size (inches) Veight (pounds) Click the icon to view the critical values of the Pearson correlation coefficient r. 45 43 43 52 52 352 374 275 314 440 367 Critical Values of the Pearson Correlation Coefficient r What is the regression equation? Critical Values of the Pearson Correlation Coefficient r a = 0.05 NOTE: To test Ho: p=0 against H, p#0, reject Ho if the absolute value of r is greater than the critical value in the table. y%3= x (Round to one decimal place as needed.) a = 0.01 4 0.950 0.990 0.878 0.959 0.811 0.917 0.754 0.875 8. 0.707 0.834 9. 0.666 0.798 10 0.632 0.765 11 0.602 0.735 12 0.576 0.708 13 0.553 0.684 14 0.532 0.661 15 0.514 0.641 16 0.497 0.623 17 0.606 0.590…arrow_forwardTwo separate tests are designed to measure a student's ability to solve problems. Several students are randomly selected to take both tests and the results are shown below. Test A (x) 43 65 73 34 99 78 65 Test B (y) 39 60 62 20 85 70 54 1. Calculate r, the linear correlation coefficient. Identify the values for each part below. Part a. The value of n Part b. The sum of the x-values Part c. The sum of the y-values Part d. The sum of the x-squared values Part e. The sum of the y-squared values Part f. The sum of the (xy) values Part g. The final value of r rounded top three decimal placesarrow_forwardA grocery store manager did a study to look at the relationship between the amount of time (in minutes) customers spend in the store and the amount of money (in dollars) they spend. The results of the survey are shown below. Time 25 8 24 6 18 16 7 12 Money 82 18 106 40 64 50 22 60 The null and alternative hypotheses for correlation are:H0:H0: ? r μ ρ Correct = 0H1:H1: ? ρ r μ Correct ≠ 0 The p-value is: (Round to four decimal places) Use a level of significance of α=0.05α=0.05 to state the conclusion of the hypothesis test in the context of the study. There is statistically insignificant evidence to conclude that there is a correlation between the amount of time customers spend at the store and the amount of money that they spend at the store. Thus, the use of the regression line is not appropriate. There is statistically insignificant evidence to conclude that a customer who spends more time at the store will spend more money than a customer who spends…arrow_forward
- What’s the correct answerarrow_forwardPls help by showing stepsarrow_forwardIf the null hypothesis is true in a test of the Pearson’s correlation between X and Y, then __________. a. higher scores of X are paired with higher scores of Y b. none of mentioned here c. higher scores of X are paired with low and high scores of Y d. higher scores of X are paired with lower scores of Y e. lower scores of X are paired with higher scores of Yarrow_forward
arrow_back_ios
arrow_forward_ios
Recommended textbooks for you
- MATLAB: An Introduction with ApplicationsStatisticsISBN:9781119256830Author:Amos GilatPublisher:John Wiley & Sons Inc
 Probability and Statistics for Engineering and th...StatisticsISBN:9781305251809Author:Jay L. DevorePublisher:Cengage Learning
 Statistics for The Behavioral Sciences (MindTap C...StatisticsISBN:9781305504912Author:Frederick J Gravetter, Larry B. WallnauPublisher:Cengage Learning
  Elementary Statistics: Picturing the World (7th E...StatisticsISBN:9780134683416Author:Ron Larson, Betsy FarberPublisher:PEARSON
 The Basic Practice of StatisticsStatisticsISBN:9781319042578Author:David S. Moore, William I. Notz, Michael A. FlignerPublisher:W. H. Freeman
 Introduction to the Practice of StatisticsStatisticsISBN:9781319013387Author:David S. Moore, George P. McCabe, Bruce A. CraigPublisher:W. H. Freeman
MATLAB: An Introduction with Applications
Statistics
ISBN:9781119256830
Author:Amos Gilat
Publisher:John Wiley & Sons Inc
Probability and Statistics for Engineering and th...
Statistics
ISBN:9781305251809
Author:Jay L. Devore
Publisher:Cengage Learning
Statistics for The Behavioral Sciences (MindTap C...
Statistics
ISBN:9781305504912
Author:Frederick J Gravetter, Larry B. Wallnau
Publisher:Cengage Learning
Elementary Statistics: Picturing the World (7th E...
Statistics
ISBN:9780134683416
Author:Ron Larson, Betsy Farber
Publisher:PEARSON
The Basic Practice of Statistics
Statistics
ISBN:9781319042578
Author:David S. Moore, William I. Notz, Michael A. Fligner
Publisher:W. H. Freeman
Introduction to the Practice of Statistics
Statistics
ISBN:9781319013387
Author:David S. Moore, George P. McCabe, Bruce A. Craig
Publisher:W. H. Freeman