MATLAB: An Introduction with Applications
6th Edition
ISBN: 9781119256830
Author: Amos Gilat
Publisher: John Wiley & Sons Inc
expand_more
expand_more
format_list_bulleted
Question

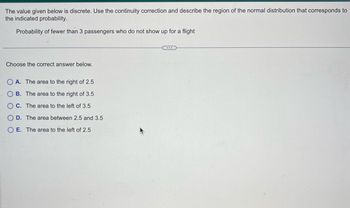
Transcribed Image Text:The value given below is discrete. Use the continuity correction and describe the region of the normal distribution that corresponds to
the indicated probability.
Probability of fewer than 3 passengers who do not show up for a flight
Choose the correct answer below.
OA. The area to the right of 2.5
OB. The area to the right of 3.5
OC. The area to the left of 3.5
OD. The area between 2.5 and 3.5
O E. The area to the left of 2.5
Expert Solution
This question has been solved!
Explore an expertly crafted, step-by-step solution for a thorough understanding of key concepts.
Step by stepSolved in 3 steps

Knowledge Booster
Similar questions
- K Find the value of the test statistic z. Round to three decimal places. The claim is that the proportion of drowning deaths of children attributable to beaches is 0.25, and the sample statistics include 620 drowning deaths of children with 30% of them attributable to beaches. A. Z-2.875 B. Z=2.717 OC. z= -2.717 OD. z 2.875arrow_forwardAssume that a randomly selected subject is given a bone density test. Those test scores are normally distributed with a mean of 0 and a standard deviation of 1. Find the probability that a given score is less than - 0.51 and draw a sketch of the region. Sketch the region. Choose the correct graph below. O A. OB. OC. D. -0.51 -0.51 0.51 0.51 -0.51 The probability is (Round to four decimal places as needed.)arrow_forward1. Find the 88th percentile of the normal curve. Lesson 5: What Can I do (Performance Task #3). Page 25. Steps Solution a. Draw the appropriate normal curve. b. Express the given percentage as probability c. Split 0.8800 into and d. Shade 0.5000 on the sketched normal curve e. Refer to the table of areas under the normal curve. Locate the area of f. Locate the nearest value g. Locate 1.08 on the curve and draw a line through under the curve h. Shade the region i. Describe the shaded regionarrow_forward
- Use the TI-84 calculator to find the z-score for which the area to its right is 0.46. Round the answer to two decimal places.arrow_forward?) H Assume that a randomly selected subject is given a bone density test. Those test scores are normally distributed with a mean of 0 and a standard deviation of 1. Draw a graph and find the probability of a bone density test score greater than 0.31. Sketch the region. Choose the correct graph below. A. В. O C. O D. -0.31 0.31 0.31 -0.31 0.31 The probability is. (Round to four decimal places as needed.) Question Viewer rcearrow_forwardUse the TI-84 calculator to find the z-score for which the area to its left Is 0.85. Round the answer to two decimal places.arrow_forward
- R A veterinarian recorded how many kittens were born in each litter. This data is summarized in the L histogram below. (Note: The last class actually represents "7 or more kittens," not just 7 kittens.) 14 12 10- 8- 6- 4 1 2 3 4 7 8 # of kittens What is the frequency of litters having at most 3 kittens? ans = Fe Ro 1 FEB 18 P. W MacBook Air 20 000 esc F5 F6 F2 F3 F4 F1 & ! @ 1 2 4 5 Q W R %24 # 3 6 2. Frequencyarrow_forwardThe data represent the results for a test for a certain disease. Assume one individual from the group is randomly selected. Find the probability of getting someone who tested positive, given that he or she had the disease. The probability is approximately (Round to three decimal places as needed.) View an example @ 2 s W S X 3 дв command # Get more help 26 80 F3 E D A GA C a R F tv % 5 V T G The individual actually had the disease O Yes No 135 Positive Negative 13 VAG 810 MacBook Air 6 B Y & 7 H F7 U 25 127 N * 8 DII 1 M ( 9 K O 0 I H qqqqqqqqı L A F10 Clear all P > л. : ; { + [ = Check answer I command option 11 18 ? F12 1 } 1 deletearrow_forwardHelp!arrow_forward
arrow_back_ios
arrow_forward_ios
Recommended textbooks for you
 MATLAB: An Introduction with ApplicationsStatisticsISBN:9781119256830Author:Amos GilatPublisher:John Wiley & Sons Inc
 Probability and Statistics for Engineering and th...StatisticsISBN:9781305251809Author:Jay L. DevorePublisher:Cengage Learning
 Statistics for The Behavioral Sciences (MindTap C...StatisticsISBN:9781305504912Author:Frederick J Gravetter, Larry B. WallnauPublisher:Cengage Learning
 Elementary Statistics: Picturing the World (7th E...StatisticsISBN:9780134683416Author:Ron Larson, Betsy FarberPublisher:PEARSON
 The Basic Practice of StatisticsStatisticsISBN:9781319042578Author:David S. Moore, William I. Notz, Michael A. FlignerPublisher:W. H. Freeman
 Introduction to the Practice of StatisticsStatisticsISBN:9781319013387Author:David S. Moore, George P. McCabe, Bruce A. CraigPublisher:W. H. Freeman

MATLAB: An Introduction with Applications
Statistics
ISBN:9781119256830
Author:Amos Gilat
Publisher:John Wiley & Sons Inc

Probability and Statistics for Engineering and th...
Statistics
ISBN:9781305251809
Author:Jay L. Devore
Publisher:Cengage Learning

Statistics for The Behavioral Sciences (MindTap C...
Statistics
ISBN:9781305504912
Author:Frederick J Gravetter, Larry B. Wallnau
Publisher:Cengage Learning

Elementary Statistics: Picturing the World (7th E...
Statistics
ISBN:9780134683416
Author:Ron Larson, Betsy Farber
Publisher:PEARSON

The Basic Practice of Statistics
Statistics
ISBN:9781319042578
Author:David S. Moore, William I. Notz, Michael A. Fligner
Publisher:W. H. Freeman

Introduction to the Practice of Statistics
Statistics
ISBN:9781319013387
Author:David S. Moore, George P. McCabe, Bruce A. Craig
Publisher:W. H. Freeman