
MATLAB: An Introduction with Applications
6th Edition
ISBN: 9781119256830
Author: Amos Gilat
Publisher: John Wiley & Sons Inc
expand_more
expand_more
format_list_bulleted
Related questions
Question
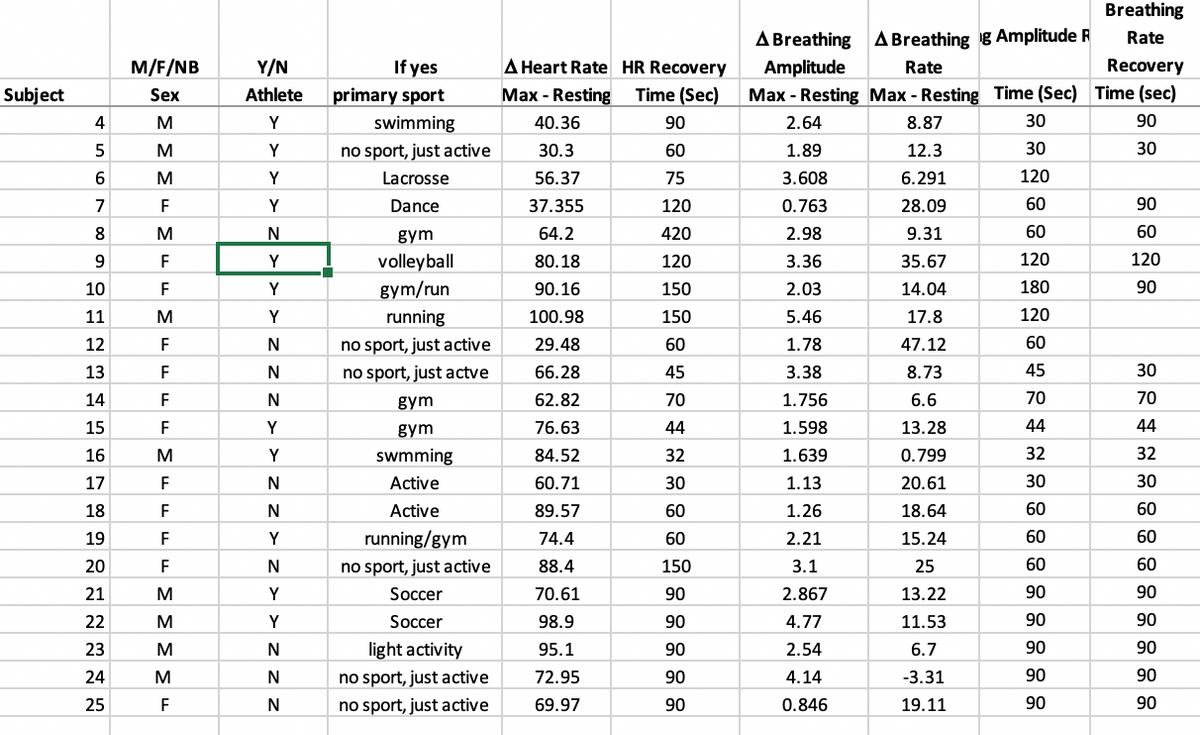
The hypothesis should revolve around one of the variables collected for all subjects. Your results section should describe the general course of one subject’s response from your individual analysis and then evaluate your hypothesis for a specific collective variable.
Please explain this in plain english. I dont understand the instructions. Here is a reference of the subjects.

Transcribed Image Text:Subject
4
5
6
7
8
9
10
11
12
13
14
15
16
17
18
19
20
21
22
23
24
25
M/F/NB
Sex
TTTTTTTTTT W T ≤ ≤ ≤ 0
M
M
M
M
M
M
M
ΣΣΣΣΗ
M
M
Y/N
Athlete
Y
Y
Y
Y
N
Y
Y
Y
N
N
N
Y
Y
N
N
Y
N
Y
Y
N
Z Z
N
N
If yes
primary sport
swimming
no sport, just active
Lacrosse
Dance
gym
volleyball
gym/run
running
no sport, just active
no sport, just actve
gym
gym
swmming
Active
Active
running/gym
no sport, just active
Soccer
Soccer
light activity
no sport, just active
no sport, just active
A Heart Rate HR Recovery
Max - Resting Time (Sec)
40.36
90
30.3
60
56.37
75
37.355
120
64.2
420
80.18
120
90.16
150
100.98
150
29.48
60
66.28
45
62.82
70
44
32
30
60
60
150
90
90
90
90
90
76.63
84.52
60.71
89.57
74.4
88.4
70.61
98.9
95.1
72.95
69.97
A Breathing
Amplitude
Max - Resting Max - Resting Time (Sec)
2.64
8.87
1.89
12.3
3.608
6.291
0.763
28.09
2.98
9.31
3.36
35.67
2.03
14.04
5.46
17.8
1.78
47.12
3.38
8.73
1.756
6.6
1.598
13.28
1.639
0.799
1.13
20.61
1.26
18.64
2.21
15.24
3.1
25
2.867
13.22
4.77
11.53
2.54
6.7
4.14
-3.31
0.846
19.11
A Breathing g Amplitude F
Rate
30
30
120
60
60
120
180
120
60
45
70
44
32
30
60
60
60
90
90
90
90
90
Breathing
Rate
Recovery
Time (sec)
90
30
90
60
120
90
30
70
44
32
30
60
60
60
90
90
90
90
90
Expert Solution
This question has been solved!
Explore an expertly crafted, step-by-step solution for a thorough understanding of key concepts.

Step by stepSolved in 4 steps

Knowledge Booster

Similar questions
- Last time you didn’t answer question c,i) in terms of the variables of score and hours. Also write the answers in more deptharrow_forwardA researcher gathered a sample of participants who volunteered for a studying of phobias. She measured anxiety level of participants as they viewed photos of spiders and again when they viewed puppies. Which statistical test is appropriate for this study and why?arrow_forwardPlease help me with the following sections: d, e, f, g, h and i Thank you!arrow_forward
- Identify each of the variables as quantitative or categorical. Also, identify each of the variables as an explanatory variable or a response variable.arrow_forwardFor the following questions, THERE IS NO NEED FOR EXPLANATION. PLEASE PROVIDE JUST THE ANSWER THANK YOU. Please DO NOT waste time on writing things to explain. Please answer in 30 mintues or else I will write a bad review. If you follow my rules and answer in less than 30 mintues then I will write a very long and wonderful review about you. ANSWER the questions correlty and please answer all the questions with what it regards in saying exactly.arrow_forwardIn a few sentences come up with your own idea for either an experimental OR observational study. Why would this study be either experimental or observational? Identify the explanatory and response variablesarrow_forward
arrow_back_ios
arrow_forward_ios
Recommended textbooks for you
- MATLAB: An Introduction with ApplicationsStatisticsISBN:9781119256830Author:Amos GilatPublisher:John Wiley & Sons Inc
 Probability and Statistics for Engineering and th...StatisticsISBN:9781305251809Author:Jay L. DevorePublisher:Cengage Learning
 Statistics for The Behavioral Sciences (MindTap C...StatisticsISBN:9781305504912Author:Frederick J Gravetter, Larry B. WallnauPublisher:Cengage Learning
  Elementary Statistics: Picturing the World (7th E...StatisticsISBN:9780134683416Author:Ron Larson, Betsy FarberPublisher:PEARSON
 The Basic Practice of StatisticsStatisticsISBN:9781319042578Author:David S. Moore, William I. Notz, Michael A. FlignerPublisher:W. H. Freeman
 Introduction to the Practice of StatisticsStatisticsISBN:9781319013387Author:David S. Moore, George P. McCabe, Bruce A. CraigPublisher:W. H. Freeman
MATLAB: An Introduction with Applications
Statistics
ISBN:9781119256830
Author:Amos Gilat
Publisher:John Wiley & Sons Inc
Probability and Statistics for Engineering and th...
Statistics
ISBN:9781305251809
Author:Jay L. Devore
Publisher:Cengage Learning
Statistics for The Behavioral Sciences (MindTap C...
Statistics
ISBN:9781305504912
Author:Frederick J Gravetter, Larry B. Wallnau
Publisher:Cengage Learning
Elementary Statistics: Picturing the World (7th E...
Statistics
ISBN:9780134683416
Author:Ron Larson, Betsy Farber
Publisher:PEARSON
The Basic Practice of Statistics
Statistics
ISBN:9781319042578
Author:David S. Moore, William I. Notz, Michael A. Fligner
Publisher:W. H. Freeman
Introduction to the Practice of Statistics
Statistics
ISBN:9781319013387
Author:David S. Moore, George P. McCabe, Bruce A. Craig
Publisher:W. H. Freeman