MATLAB: An Introduction with Applications
6th Edition
ISBN: 9781119256830
Author: Amos Gilat
Publisher: John Wiley & Sons Inc
expand_more
expand_more
format_list_bulleted
Concept explainers
Question

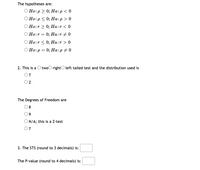
Transcribed Image Text:The hypotheses are:
О Но:р 2 0; На:р <0
Но:p < 0%;B На:р>0
О Но:r> 0; На:r < 0
Ho:r:
0; На:r #0
Ho:r < 0; Ha:r > 0
O Ho:p = 0; Ha:p # 0
2. This is a O twoO rightO left tailed test and the distribution used is
OT
Oz
The Degrees of Freedom are
O8
9
O N/A; this is a Z-test
07
3. The STS (round to 3 decimals) is:
The P-value (round to 4 decimals) is:

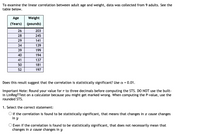
Transcribed Image Text:To examine the linear correlation between adult age and weight, data was collected from 9 adults. See the
table below.
Age
Weight
(Years) (pounds)
26
203
28
245
29
141
34
139
39
199
40
194
41
137
50
181
52
197
Does this result suggest that the correlation is statistically significant? Use a = 0.01.
Important Note: Round your value for r to three decimals before computing the STS. DO NOT use the built-
in LinRegTTest on a calculator because you might get marked wrong. When computing the P-value, use the
rounded STS.
1. Select the correct statement:
O f the correlation is found to be statistically significant, that means that changes in æ cause changes
in y
O Even if the correlation is found to be statistically significant, that does not necessarily mean that
changes in æ cause changes in y
Expert Solution
This question has been solved!
Explore an expertly crafted, step-by-step solution for a thorough understanding of key concepts.
This is a popular solution
Trending nowThis is a popular solution!
Step by stepSolved in 2 steps with 2 images

Knowledge Booster
Learn more about
Need a deep-dive on the concept behind this application? Look no further. Learn more about this topic, statistics and related others by exploring similar questions and additional content below.Similar questions
- 1. A random variable, X, follows a hypergeometric distribution with N=50, a=10 and n=6. Which of the following is NOT a possible value for X? A. 0 A. 25% 2. A random variable, X, has a mean of 100 and variance of 64. Which of the following is not a possible value for P(84 8) C. 6 A. binomial 3. It is known that the number of misprints on a textbook page follows a Poisson distribution with a mean of 0.004. Which of the following is the standard deviation of the number of misprints on a textbook of 475 pages? B. 0.063 C. 85% D. 10 C. 1.9 D. 95% 4. X is a discrete random variable, which of the following quantities is the same as P(X2 8)? B. 1-P(X 8) 5. Which of the following random variables could have a variance greater than its mean? C. geometric B. hyper-geometric D. 1.378 D. 1- P(X≤8) D. Poissonarrow_forwardb. Normal curve d. None of these 5. For a z-test of proportions, which of the following is the rejection region for a two- tailed test? a. z>Za orz>-Za c. z-Za b. z>-Za/2 or z > Za/2 d. z Za/2 6. For a z-test of proportions, which of the following is the rejection region for a one- tailed test? a. z> Za or z Za or z>-Za b. z-Za d. z>-Za/z or z> Za/2 7. For the 95% confidence level, what is the value for a? a. a= .01 c. a.10 b. a = .05 d. a = .025 8. When the null hypothesis is rejected, which of the following is true? a. There is sufficient evidence to back up the decision. b. There is no sufficient evidence to back up the decision. ab Module...arrow_forwardSuppose X1,., Xn, for n > 1, are sampled independently from a distribution with mean u and variance o?. Consider the following four estimators for X1+ Xn 2 X1 2 п(п + 1) i=1 a. Calculate the bias of each of these estimators. b. Calculate the standard error for each estimator. c. Which estimator would you choose to use? (Give a reason for your choice).arrow_forward
- Consider a random sample of size n from a normal distribution with unknown mean u and unknown variance o?. Suppose the sample mean is X and the sample variance is S?. n = 16, the observed sample mean i is 8.9. the observed sample variance s? is 25 and 4o : 10.5. Suppose we now want to test Ho : o? = of versus H1 : o? + of. Which of these test statistics should we use? Select one: (n-1)s? W = of a. O b. Z %3D O c. T= S/n Let o = 36. What is the (appropriate) observed test statistic? Give answer to three decimal places. What is the p-value of the (appropriate) observed test statistic for testing Ho : o? = of versus H1 : o? + of you just computed? Give answer to three decimal places.arrow_forwardUSE THE T-DISTRIBUTION AND THE GIVEN SAMPLE RESULTS TO COMPLETE THE TEST OF THE GIVEN HYPOTHESE S. ASSUME THE RESULTS COME FROM RANDOM SAMPLES, AND IF THE SAMPLE SIZES ARE SMALL. ASSUME THE UNDERLYING DISTRIBUTIONS ARE RELATIVELY NORMAL. TEST Ho: MIU 1= MIU 2 VS Ha: MIU1>MIU 2 USING THE SAMPLE RESULTS x̅1= 56 S1= 8.2 WITH N1 = 30 AND x̅ 2= 51, S2=6.9 WITH N2 =40. GIVE THE TEST STATISTIC AND THE P-VALUE WHAT IS THE CONCLUSION OF THE TEST ? AT A 5% LEVEL.arrow_forwardThe following histogram shows the distribution of 1000 sample observations from a population with a mean of u=4 and a variance of o = 8. 10 Suppose a simple random sample of 100 observations is to be selected from the population and the sample average x is calculated. Which of the following statements about the distribution of is/are FALSE? A) The distribution of x will have a mean of 4. B) The distribution x will be approximately Normal. C) Because the distribution shown in the histogram above is clearly skewed to the right, the shape of the distribution of x will also show skewness to the right. D) Even though the distribution of the population variable appears to be skewed to the right, the distribution of x will be approximately symmetric around u= 4. E) The standard deviation of the distribution of x will be 0.283.arrow_forward
- Assume that X has a normal distribution, and find the indicated probability. 7) The mean is μ = 15.2 and the standard deviation is o = 0.9. Find the probability that X is between 14.3 and 16.1. A) 0.1587 B) 0.6826 C) 0.8413 D) 0.3413 7)arrow_forward4. Bags of a certain brand of tortilla chips claim to have a net weight of 14 ounces. Net weights actually vary slightly from bag to bag and are Normally distributed with mean μ. A representative of a consumer advocate group wishes to see if there is any evidence that the mean net weight is less than advertised and so intends to test the hypotheses Ho: = 14, Ha: < 14. To do this, he selects 16 bags of this brand at random and determines the net weight of each. A Type I error in this setting would mean (a) concluding that the bags are being underfilled when they actually aren't. (b) concluding that the bags are being underfilled when they actually are. concluding that the bags are not being underfilled when they actually are. (d) concluding that the bags are not being underfilled when they actually aren't. (e) none of thesearrow_forwardUse a T-table if necessary.arrow_forward
arrow_back_ios
arrow_forward_ios
Recommended textbooks for you
 MATLAB: An Introduction with ApplicationsStatisticsISBN:9781119256830Author:Amos GilatPublisher:John Wiley & Sons Inc
 Probability and Statistics for Engineering and th...StatisticsISBN:9781305251809Author:Jay L. DevorePublisher:Cengage Learning
 Statistics for The Behavioral Sciences (MindTap C...StatisticsISBN:9781305504912Author:Frederick J Gravetter, Larry B. WallnauPublisher:Cengage Learning
 Elementary Statistics: Picturing the World (7th E...StatisticsISBN:9780134683416Author:Ron Larson, Betsy FarberPublisher:PEARSON
 The Basic Practice of StatisticsStatisticsISBN:9781319042578Author:David S. Moore, William I. Notz, Michael A. FlignerPublisher:W. H. Freeman
 Introduction to the Practice of StatisticsStatisticsISBN:9781319013387Author:David S. Moore, George P. McCabe, Bruce A. CraigPublisher:W. H. Freeman

MATLAB: An Introduction with Applications
Statistics
ISBN:9781119256830
Author:Amos Gilat
Publisher:John Wiley & Sons Inc

Probability and Statistics for Engineering and th...
Statistics
ISBN:9781305251809
Author:Jay L. Devore
Publisher:Cengage Learning

Statistics for The Behavioral Sciences (MindTap C...
Statistics
ISBN:9781305504912
Author:Frederick J Gravetter, Larry B. Wallnau
Publisher:Cengage Learning

Elementary Statistics: Picturing the World (7th E...
Statistics
ISBN:9780134683416
Author:Ron Larson, Betsy Farber
Publisher:PEARSON

The Basic Practice of Statistics
Statistics
ISBN:9781319042578
Author:David S. Moore, William I. Notz, Michael A. Fligner
Publisher:W. H. Freeman

Introduction to the Practice of Statistics
Statistics
ISBN:9781319013387
Author:David S. Moore, George P. McCabe, Bruce A. Craig
Publisher:W. H. Freeman