MATLAB: An Introduction with Applications
6th Edition
ISBN: 9781119256830
Author: Amos Gilat
Publisher: John Wiley & Sons Inc
expand_more
expand_more
format_list_bulleted
Concept explainers
Topic Video
Question
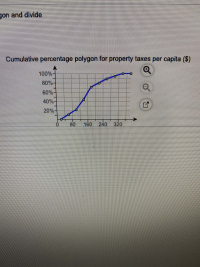
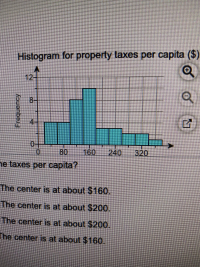
The histogram and cumulative percentage polygon below visualize the property taxes per capita for 37 locations. What conclusions can you reach concerning the property taxes per capita? Hint: disregard the polygon and divide by n for a percentage.
Which of these conclusions can you reach concerning the taxes per capita?
A. Approximately 86% of the data fall below $100. The center is at about $160.
B. Approximately 47% of the data fall below $100. The center is at about $200
C. Approximately 11% of the data fall below $260. The center is at about $200
D. Approximately 11% of the data fall below $60. The center is at about $160


Expert Solution
This question has been solved!
Explore an expertly crafted, step-by-step solution for a thorough understanding of key concepts.
This is a popular solution
Trending nowThis is a popular solution!
Step by stepSolved in 2 steps

Knowledge Booster
Learn more about
Need a deep-dive on the concept behind this application? Look no further. Learn more about this topic, statistics and related others by exploring similar questions and additional content below.Similar questions
- please answer in text form and in proper format answer with must explanation , calculation for each part and steps clearlyarrow_forward5. See pictures to solvearrow_forwardFIND THE ANSWERS FOR B-2 and C. A survey found that Massachusetts residents spent an average of $861.75 on the lottery, more than three times the U.S. average. A researcher at a Boston think tank believes that Massachusetts residents spend less than this amount. He surveys 100 Massachusetts residents and asks them about their annual expenditures on the lottery. (You may find it useful to reference the t table.) Click here for the Excel Data File a. Specify the competing hypotheses to test the researcher’s claim.multiple choice 1 H0: μ ≥ 861.75; HA: μ < 861.75 b-1. Calculate the value of the test statistic. (Negative value should be indicated by a minus sign. Round final answer to 3 decimal places.) -0.863 b-2. Find the p-value.multiple choice 2 p-value < 0.01 0.01 p-value < 0.025 0.025 p-value < 0.05 0.05 p-value < 0.10 p-value 0.10 c. At α = 0.10, what is the conclusion?multiple choice 3 Reject H0; there is insufficient evidence…arrow_forward
- Determine whether the data sets show a direct variation. Number of Baskets NMT 00 2 3 4 8 11 true false Cost $6 $9 $12 $24 $33arrow_forwardThe box plots below show how fast cars are travelling at a specific time of a day on highway I-5 and l-405 in King county. Fill in the blank. I-405 I-5 45 50 55 60 65 70 75 Speed (miles per hour) If Jay is driving at the median speed on l-5, he is driving faster than % of drivers on l-405.arrow_forwardIn a month where the price of eggs is above average, would you expect the price of milk to be above average or below average? Explain.arrow_forward
- With aging, body fat increases and muscle mass declines. The line graphs show the percent body fat in adult females and males as they age from 25 to 75 years. Use this information to complete parts (a) through (c) below. a. Find an estimate for the percent body fat in 45-year-old females. % (Type a whole number.) Percent Body Fat 40 36- 32- 28- 24 20+ 15 Percent Body Fat in Adults 25 35 45 Age Females Males 55 65 75arrow_forwardK Disk drives have been getting larger. Their capacity is now often given in terabytes (TB) where 1 TB = 1000 gigabytes, or about a trillion bytes. A survey of prices for external disk drives found the data shown to the right. For this data, we want to predict Price from Capacity. Complete parts a through i below. Click the icon to view the disk drive data and summary statistics. Disk Drive Data and Summary Statistics Capacity (in TB) 0.5 1.0 2.0 3.0 4.0 6.0 8.0 12.0 32.0 x = 7.611 SD(x) = 9.85 r = 0.987 --- Print Price (in $) 58.79 75.79 114.00 105.95 146.45 425.49 594.00 1074.00 4464.49 y = 784.329 SD(y) = 1420.27 Done X A. It indicates the price for a hard drive with no capacity. It is meaningless and should not be interpreted. B. It indicates the additional capacity in TB for each additional dollar of price. It is meaningful in that it could be interpreted as the cost of the parts common to all drives.arrow_forward
arrow_back_ios
arrow_forward_ios
Recommended textbooks for you
 MATLAB: An Introduction with ApplicationsStatisticsISBN:9781119256830Author:Amos GilatPublisher:John Wiley & Sons Inc
 Probability and Statistics for Engineering and th...StatisticsISBN:9781305251809Author:Jay L. DevorePublisher:Cengage Learning
 Statistics for The Behavioral Sciences (MindTap C...StatisticsISBN:9781305504912Author:Frederick J Gravetter, Larry B. WallnauPublisher:Cengage Learning
 Elementary Statistics: Picturing the World (7th E...StatisticsISBN:9780134683416Author:Ron Larson, Betsy FarberPublisher:PEARSON
 The Basic Practice of StatisticsStatisticsISBN:9781319042578Author:David S. Moore, William I. Notz, Michael A. FlignerPublisher:W. H. Freeman
 Introduction to the Practice of StatisticsStatisticsISBN:9781319013387Author:David S. Moore, George P. McCabe, Bruce A. CraigPublisher:W. H. Freeman

MATLAB: An Introduction with Applications
Statistics
ISBN:9781119256830
Author:Amos Gilat
Publisher:John Wiley & Sons Inc

Probability and Statistics for Engineering and th...
Statistics
ISBN:9781305251809
Author:Jay L. Devore
Publisher:Cengage Learning

Statistics for The Behavioral Sciences (MindTap C...
Statistics
ISBN:9781305504912
Author:Frederick J Gravetter, Larry B. Wallnau
Publisher:Cengage Learning

Elementary Statistics: Picturing the World (7th E...
Statistics
ISBN:9780134683416
Author:Ron Larson, Betsy Farber
Publisher:PEARSON

The Basic Practice of Statistics
Statistics
ISBN:9781319042578
Author:David S. Moore, William I. Notz, Michael A. Fligner
Publisher:W. H. Freeman

Introduction to the Practice of Statistics
Statistics
ISBN:9781319013387
Author:David S. Moore, George P. McCabe, Bruce A. Craig
Publisher:W. H. Freeman