
ENGR.ECONOMIC ANALYSIS
14th Edition
ISBN: 9780190931919
Author: NEWNAN
Publisher: Oxford University Press
expand_more
expand_more
format_list_bulleted
Related questions
Question
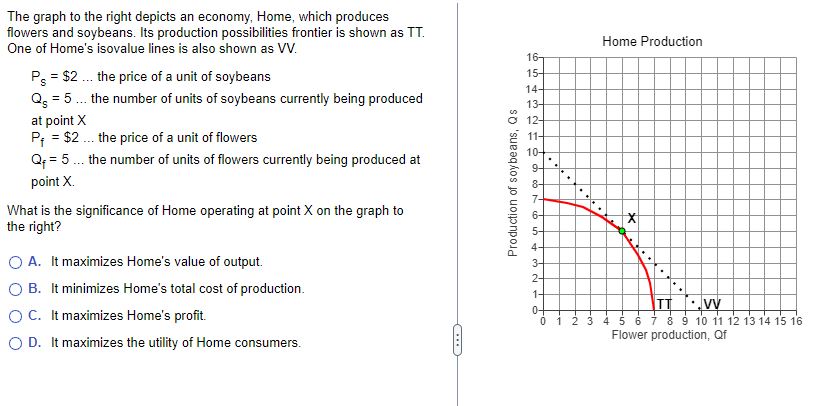

Transcribed Image Text:The graph to the right depicts an economy, Home, which produces
flowers and soybeans. Its production possibilities frontier is shown as TT.
One of Home's isovalue lines is also shown as VV.
Ps = $2 ... the price of a unit of soybeans
Q = 5 ... the number of units of soybeans currently being produced
at point X
P $2... the price of a unit of flowers
=
Q₁ = 5... the number of units of flowers currently being produced at
point X.
What is the significance of Home operating at point X on the graph to
the right?
A. It maximizes Home's value of output.
B. It minimizes Home's total cost of production.
OC. It maximizes Home's profit.
OD. It maximizes the utility of Home consumers.
C
Production of soybeans, Qs
16-
15-
14-
13-
12-
11-
10-
7-
Home Production
6-
☑
5-
4-
3-
2-
1-
0-
TT
⚫JVV
0 1 2 3 4 5 6 7 8 9 10 11 12 13 14 15 16
Flower production, Qf
Expert Solution
This question has been solved!
Explore an expertly crafted, step-by-step solution for a thorough understanding of key concepts.

This is a popular solution

Trending nowThis is a popular solution!

Step by stepSolved in 2 steps

Knowledge Booster

Similar questions
- Use the following information to answer the next six questions. The accompanying graph depicts the demand (D) curve for general admission concert tickets to see ECON-Jammin', the world's first economics rock band, which is scheduled to visit your city next month. The concert venue can accommodate 100 fans with a marginal cost (MC) of $10 per person. Price $50 $40 $30 $20 $10 0 10 20 MR 30 40 D MC 50 60 Quantity ECON-Jammin' has recently discovered that its fans are made up of two distinct groups that can be easily distinguished. The band has decided to utilize its economic knowledge and offer a high-priced ticket of $40 per person and a low-priced ticket of $20 per person. Based on this information, what is the gain in profit from using price discrimination versus a single-price model? O a. $150 O b. $100 O c. $0 O d. $50 O e. $200arrow_forward7 10 points ebook Print References The graph below shows the market for soya beans: Plot the two end points using the tool provided in the graphing area below. Plot only the end points of the curve and position those points on the edge of the graphing area. Price per kilo 16 14 12 10 8 6 4 2 0 25 175 200 Soya beans (millions of kilos) 75 50 100 125 150 D 225 275. 250 300 Tools line 4arrow_forwardThe graph shows the market for cashews. What is the equilibrium price of cashews? What is the equilibrium quantity of cashews? Is the market for cashews efficient or inefficient? Why? CIER The equilibrium price of cashews is $ a pound and the equilibrium quantity of cashews is pounds. The market for cashews is O A. inefficient only if the cost of growing all the cashews is an average of $6.00 a pound OB. efficient because the marginal benefit of cashews equals the marginal cost of producing them, which is $6.00 a pound OC. inefficient because growers of cashews receive a large producer surplus O D. efficient because the benefit of each pound of cashews consumed equals the cost of growing it OE. efficient only if the total benefit of the cashews equals $6.00 a pound billion A 12.00- 10.00- 8.00- 6.00+ 4.00- 2.00- 0.00+ 0 Price (dollars per pound) S 3 9 12 6 Quantity (billions of pounds per year) D 15 Q Qarrow_forward
- Assume that the graphs show a competitive market for the product stated in the question. Which graph would explain the change in the market for apples if the market price of apples increases and the quantity sold in the market decrease?arrow_forward2.13 APPLYING KEY CONCEPTS Learning curve. In each problem below, there is an explanation of something that has happened to one of the non-price factors that affects supply. The original supply curve, labeled "S1," has been drawn for you. Draw a new supply curve that reflects the change in supply. Label the new curve "S2." | Change | Your Response Ex: The price of low-grade meat increases. Supply of DECADOGS Indicate what will happen to the supply of DECADOGS, a nationally- recognized brand of hotdog. S2, S,arrow_forwardThe market for bell peppers is competitive. For bell peppers to grow properly they need substantial rainfall. A very dry winter in California did not produce enough rain to grow bell peppers in California, one of the major bell pepper growing regions of the world. In the graph below, click on the equilibrium point that illustrates the effect of insufficient rainfall on the market for bell peppers. P 0 D" S $arrow_forward
- N.B: It is note an examarrow_forwardSuppose the daily demand for soda is given by P=4-(2/3)Q and the daily supply of soda is given by P= 1+ (1/3)Q, where P is the dollar price of a can of soda and Q is the number of cans of soda (in thousands). a. Sketch the demand curve and the supply curve. Instructions: Use the tools provided to draw the demand and supply curves. Plot each end point (4 points total). Ⓡ Price ($/can) 6 LO 5 + 3 2 1 0 Market for Soda 1 2 3 4 5 6 Quantity (1,000s of cans per day) Tools / Demand / Supplyarrow_forwardpls, solve this ques within 10-15 minutes with clear explanations and also explain why other options are wrong I'll give you multiple upvotes.arrow_forward
- SECTION A Answer All Questions 1. Which of the following questions is a type that tools of econometrics are meant to answer? A. If goods A and B are substitutes and the price of good A increases by KSH 10, by how much will the quantity demanded of good B change by? B. If goods A and B are substitutes and the price of good A increases, how will this affect the demand for good B? C. If an income increase causes the sales of good A to fall, everything else held constant, what type of good is good A? D. Everything else the same, would the price of good A be higher in a competitive industry or a monopolistic industry? 2. Consider the model Qª = ƒ (P, P³,Pº, INC) where Qªis quantity demanded of a bar soap per month, P is the price per bar of soap, Ps is the price of substitutes, P is the price of complements, and INC is monthly income. This equation represents A. a non-linear model B. an economic model C. an econometric model D. an interval forecastarrow_forwardConsider the market for new houses. If the price of lumber increases significantly, explain the effect of the change on the market equilibrium for new houses. Use the 4 step process in your answer. View keyboard shortcutsarrow_forwardNote: Once you enter a value in a white field, the graph and any corresponding amounts in each grey field will change accordingly. Graph Input Tool Market for Teapots 100 I Price (Dollars per teapot) 90 20 Supply 80 Quantity Supplied (Teapots) Quantity Demanded 190 310 70 (Teapots) 60 50 40 Demand 30 20 10 50 100 150 200 250 300 350 400 450 500 QUANTITY (Teapots) The equilibrium price in this market is $ per teapot, and the equilibrium quantity is teapots bought and sold per month. Complete the following table by indicating at each price whether there is a shortage or surplus in the market, the amount of that shortage or surplus, and whether this places upward or downward pressure on prices. Price Shortage or Surplus Amount (Dollars per teapot) Shortage or Surplus (Teapots) Pressure 40 60 PRICE (Dollars per teapot)arrow_forward
arrow_back_ios
SEE MORE QUESTIONS
arrow_forward_ios
Recommended textbooks for you
 Principles of Economics (12th Edition)EconomicsISBN:9780134078779Author:Karl E. Case, Ray C. Fair, Sharon E. OsterPublisher:PEARSON
 Engineering Economy (17th Edition)EconomicsISBN:9780134870069Author:William G. Sullivan, Elin M. Wicks, C. Patrick KoellingPublisher:PEARSON
 Principles of Economics (MindTap Course List)EconomicsISBN:9781305585126Author:N. Gregory MankiwPublisher:Cengage Learning
 Managerial Economics: A Problem Solving ApproachEconomicsISBN:9781337106665Author:Luke M. Froeb, Brian T. McCann, Michael R. Ward, Mike ShorPublisher:Cengage Learning
 Managerial Economics & Business Strategy (Mcgraw-...EconomicsISBN:9781259290619Author:Michael Baye, Jeff PrincePublisher:McGraw-Hill Education
Principles of Economics (12th Edition)
Economics
ISBN:9780134078779
Author:Karl E. Case, Ray C. Fair, Sharon E. Oster
Publisher:PEARSON
Engineering Economy (17th Edition)
Economics
ISBN:9780134870069
Author:William G. Sullivan, Elin M. Wicks, C. Patrick Koelling
Publisher:PEARSON
Principles of Economics (MindTap Course List)
Economics
ISBN:9781305585126
Author:N. Gregory Mankiw
Publisher:Cengage Learning
Managerial Economics: A Problem Solving Approach
Economics
ISBN:9781337106665
Author:Luke M. Froeb, Brian T. McCann, Michael R. Ward, Mike Shor
Publisher:Cengage Learning
Managerial Economics & Business Strategy (Mcgraw-...
Economics
ISBN:9781259290619
Author:Michael Baye, Jeff Prince
Publisher:McGraw-Hill Education