MATLAB: An Introduction with Applications
6th Edition
ISBN: 9781119256830
Author: Amos Gilat
Publisher: John Wiley & Sons Inc
expand_more
expand_more
format_list_bulleted
Question

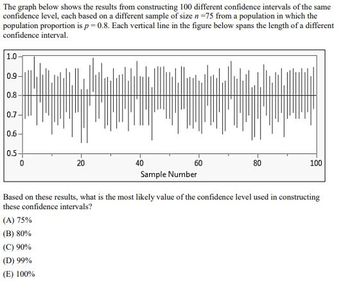
Transcribed Image Text:The graph below shows the results from constructing 100 different confidence intervals of the same
confidence level, each based on a different sample of size n =75 from a population in which the
population proportion is p=0.8. Each vertical line in the figure below spans the length of a different
confidence interval.
1.0-
0.9-
0.8
0.7
0.6-
0.5
0
20
40
60
80
100
Sample Number
Based on these results, what is the most likely value of the confidence level used in constructing
these confidence intervals?
(A) 75%
(B) 80%
(C) 90%
(D) 99%
(E) 100%
Expert Solution
This question has been solved!
Explore an expertly crafted, step-by-step solution for a thorough understanding of key concepts.
Step by stepSolved in 2 steps

Knowledge Booster
Similar questions
- If n = 15, ¯xx¯ = 36, and s = 12, construct a confidence interval at a 90% confidence level. Assume the data came from a normally distributed population. Give your answers to three decimal places.arrow_forwardHow do you solve this problem?arrow_forwardif n=20, x=43, and s=9, construct a confidence interval at a 98% confidence level, the data came from a normally distributed population.arrow_forward
- If actual period demand varies from the forecast by more than 3MAD, this indicates: there is 3% chance that the forecast is wrong. there is a 98% chance that the forecast is wrong. there is a 97% chance that the forecast is wrong. there is a 3% chance that the forecast is correct Moving to the next question prevents changes to this answer:arrow_forwardIf n=14, ¯xx¯(x-bar)=34, and s=4, construct a confidence interval at a 80% confidence level. Assume the data came from a normally distributed population.arrow_forwardIf n=200 and X=70, construct a 99% confidence interval estimate for the population proportion. SAS (Round to four decimal places as needed.)arrow_forward
- If n=20, ¯xx¯(x-bar)=43, and s=10, construct a confidence interval at a 98% confidence level. Assume the data came from a normally distributed population.Give your answers to one decimal place.arrow_forwardCan you please help me with this question?arrow_forwardImagine that you obtain a random sample of 125 M&M candies, and you notice that 28% of these candies are blue. If we convert the sample percentage of 0.28 to a sample proportion (by dividing 28 by 100), we get 0.28.arrow_forward
- Which type of confidence interval should you use in this situation? A sample of 25 different payroll departments found that the employees worked an average of 310.3 days a year with a standard deviation of 23.8 days. The distribution is approximately normally distributed. Find the 90% confidence interval for the average days worked of all payroll departments. Question 2 options: 1) a confidence interval for the mean using a table value from the standard normal distribution. 2) a confidence interval for the mean using a table value from the t distribution. 3) a confidence interval for a proportion using a table value from the standard normal distribution. 4) a confidence interval for proportion using a table value from the t distribution. 5) none of the above.arrow_forwardcreate a 90% confidence interval for the following data: x = 25 n = 100arrow_forwardIf n=17, ¯xx¯(x-bar)=50, and s=20, construct a confidence interval at a 98% confidence level. Assume the data came from a normally distributed population.arrow_forward
arrow_back_ios
arrow_forward_ios
Recommended textbooks for you
 MATLAB: An Introduction with ApplicationsStatisticsISBN:9781119256830Author:Amos GilatPublisher:John Wiley & Sons Inc
 Probability and Statistics for Engineering and th...StatisticsISBN:9781305251809Author:Jay L. DevorePublisher:Cengage Learning
 Statistics for The Behavioral Sciences (MindTap C...StatisticsISBN:9781305504912Author:Frederick J Gravetter, Larry B. WallnauPublisher:Cengage Learning
 Elementary Statistics: Picturing the World (7th E...StatisticsISBN:9780134683416Author:Ron Larson, Betsy FarberPublisher:PEARSON
 The Basic Practice of StatisticsStatisticsISBN:9781319042578Author:David S. Moore, William I. Notz, Michael A. FlignerPublisher:W. H. Freeman
 Introduction to the Practice of StatisticsStatisticsISBN:9781319013387Author:David S. Moore, George P. McCabe, Bruce A. CraigPublisher:W. H. Freeman

MATLAB: An Introduction with Applications
Statistics
ISBN:9781119256830
Author:Amos Gilat
Publisher:John Wiley & Sons Inc

Probability and Statistics for Engineering and th...
Statistics
ISBN:9781305251809
Author:Jay L. Devore
Publisher:Cengage Learning

Statistics for The Behavioral Sciences (MindTap C...
Statistics
ISBN:9781305504912
Author:Frederick J Gravetter, Larry B. Wallnau
Publisher:Cengage Learning

Elementary Statistics: Picturing the World (7th E...
Statistics
ISBN:9780134683416
Author:Ron Larson, Betsy Farber
Publisher:PEARSON

The Basic Practice of Statistics
Statistics
ISBN:9781319042578
Author:David S. Moore, William I. Notz, Michael A. Fligner
Publisher:W. H. Freeman

Introduction to the Practice of Statistics
Statistics
ISBN:9781319013387
Author:David S. Moore, George P. McCabe, Bruce A. Craig
Publisher:W. H. Freeman