MATLAB: An Introduction with Applications
6th Edition
ISBN: 9781119256830
Author: Amos Gilat
Publisher: John Wiley & Sons Inc
expand_more
expand_more
format_list_bulleted
Question

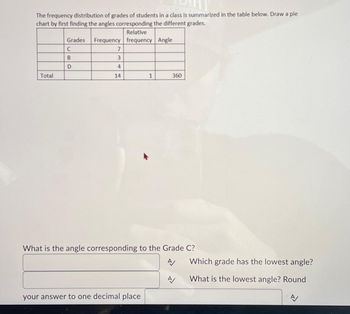
Transcribed Image Text:The frequency distribution of grades of students in a class is summarized in the table below. Draw a pie
chart by first finding the angles corresponding the different grades.
Relative
Frequency frequency Angle
Total
Grades
C
B
D
7
3
4
14
1
your answer to one decimal place
360
What is the angle corresponding to the Grade C?
A/
A
Which grade has the lowest angle?
What is the lowest angle? Round
A/
Expert Solution
This question has been solved!
Explore an expertly crafted, step-by-step solution for a thorough understanding of key concepts.
Step by stepSolved in 3 steps with 7 images

Knowledge Booster
Similar questions
- Draw a pictograph to represent the data displayed in the table below. Choose whatever symbol you like and be sure to include a key with the scale that you used. Subject Number of Students Math 16 Science 8. English 12 History 8. Art 4 Subject Number of Students Math Science English History Art Key:arrow_forwardCan you answer ONLY 28 G and H thanks i only need G AND Harrow_forwardFind the indicated z-scores shown in the graph. Click to view page 1 of the table. Click to view page 2 of the table. The z-scores are (Use a comma to separate answers as needed. Round to two decimal places as needed.) C Az 0.0294 Z=? 0 Z=? 0.0294arrow_forward
- On the right are raw test scores from a history test. a. Construct an ordered stem and leaf plot for the given data. b. Construct a grouped frequency table for these scores with intervals of 5, starting the first class at 55. c. Draw a histogram of the data. d. If a circle graph of the grouped data in (b) were drawn, how many degrees would be in the section representing the 55–59 interval? 55 61 72 80 94 61 71 79 72 74 77 79 88 83 89 86 88 81 86 82 80 97 92 94 94arrow_forwardMAarrow_forwardI need whole colum, not only first given line. Can you please help me w this?arrow_forward
- A Fun-Size bag of M&M's contains 5 green, 4 red, 3 yellow, 6 orange, 4 blue, and 2 brown candies. Construct a relative frequency table of the results. Use two decimal places in your relative frequencies. Color Proportion Green i Red i Yellow i Orange Blue i Brown Total 1.00arrow_forwardPlease solve and explain #2arrow_forwardIt’s number 17 please I need help making the frequency table and finding the ages of the most common winnersarrow_forward
- A histogram titled "20 Busiest North American Airports" has a horizontal axis labeled "Total Passengers (Millions)" and a vertical axis labeled "Frequency" with values from 0 to 10. The histogram has 8 bars. Each bar is associated with a label and an approximate value as listed below. Frequency 10 O 0 7 02 8 3 30-39.9 20 Busiest North American Airports 40-49.9 50-59.9 Total Passengers (Millions) What is the lowest frequency value? 60-69.9 70-79.9 80-89.9 90-99.9 100-109.9arrow_forwardClasses Basketball 8 Football 2 Cricket 4 Swimming 11 5 Tennis Frequency Angle on the pie chart Total 6. Complete the table above and create a pie chart.arrow_forwardA data set is summarized in the frequency table below. The data set contains a total of 30 data values. What is the missing frequency? Value Frequency 1 5 2 3 3 4 4 6 5 □ 6 2 7 3 8 4arrow_forward
arrow_back_ios
SEE MORE QUESTIONS
arrow_forward_ios
Recommended textbooks for you
 MATLAB: An Introduction with ApplicationsStatisticsISBN:9781119256830Author:Amos GilatPublisher:John Wiley & Sons Inc
 Probability and Statistics for Engineering and th...StatisticsISBN:9781305251809Author:Jay L. DevorePublisher:Cengage Learning
 Statistics for The Behavioral Sciences (MindTap C...StatisticsISBN:9781305504912Author:Frederick J Gravetter, Larry B. WallnauPublisher:Cengage Learning
 Elementary Statistics: Picturing the World (7th E...StatisticsISBN:9780134683416Author:Ron Larson, Betsy FarberPublisher:PEARSON
 The Basic Practice of StatisticsStatisticsISBN:9781319042578Author:David S. Moore, William I. Notz, Michael A. FlignerPublisher:W. H. Freeman
 Introduction to the Practice of StatisticsStatisticsISBN:9781319013387Author:David S. Moore, George P. McCabe, Bruce A. CraigPublisher:W. H. Freeman

MATLAB: An Introduction with Applications
Statistics
ISBN:9781119256830
Author:Amos Gilat
Publisher:John Wiley & Sons Inc

Probability and Statistics for Engineering and th...
Statistics
ISBN:9781305251809
Author:Jay L. Devore
Publisher:Cengage Learning

Statistics for The Behavioral Sciences (MindTap C...
Statistics
ISBN:9781305504912
Author:Frederick J Gravetter, Larry B. Wallnau
Publisher:Cengage Learning

Elementary Statistics: Picturing the World (7th E...
Statistics
ISBN:9780134683416
Author:Ron Larson, Betsy Farber
Publisher:PEARSON

The Basic Practice of Statistics
Statistics
ISBN:9781319042578
Author:David S. Moore, William I. Notz, Michael A. Fligner
Publisher:W. H. Freeman

Introduction to the Practice of Statistics
Statistics
ISBN:9781319013387
Author:David S. Moore, George P. McCabe, Bruce A. Craig
Publisher:W. H. Freeman