MATLAB: An Introduction with Applications
6th Edition
ISBN: 9781119256830
Author: Amos Gilat
Publisher: John Wiley & Sons Inc
expand_more
expand_more
format_list_bulleted
Question

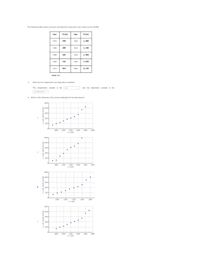
Transcribed Image Text:The following table shows economic development measured in per capita income PCINC.
Year
PCINC
Year
PCINC
1870
339
1920
1,040
1880
490
1930
1, 166
1890
591
1940
1,362
1900
747
1950
1, 842
1910
918
1960
2, 123
Table 12.7
a.
What are the independent and dependent variables?
The independent variable is the
and the dependent variable is the
yesar
pr pla me
b. Which of the following is the correct scatterplat for the data above?
2500
2 2000-
a 1500
1000-
A 500-
1980
1920
X- year
1880
1940
1960
1900
2500
2000-
1500
1000-
a 500-
1880
1900
1920
1940
1960
1980
X- year
2500-
2000-
1500
1000
500
1880
1900
1920
X- year
1940
1960
2500
2000-
1500
1000
500
1880
1900
1920
1940
1960
1980
X-year
aucoM eyndeo ad - d

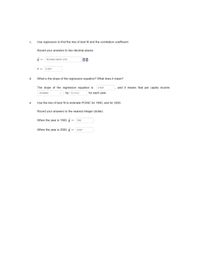
Transcribed Image Text:C.
Use regression to find the line of best fit and the correlation coefficient.
Round your answers to two decimal places.
y =
18.639x-34631.479
r =
0.947
d.
What is the slope of the regression equation? What does it mean?
The slope of the regression equation is
0.947
and it means that per capita income
by Number
for each year.
increases
е.
Use the line of best fit to estimate PCINC for 1900, and for 2000.
Round your answers to the nearest integer (dollar).
When the year is 1900, y
783
When the year is 2000, y
2447
Expert Solution
This question has been solved!
Explore an expertly crafted, step-by-step solution for a thorough understanding of key concepts.
This is a popular solution
Trending nowThis is a popular solution!
Step by stepSolved in 6 steps with 3 images

Knowledge Booster
Similar questions
- 2. Calculate the Pearson correlation for the following data X Y 13 915 31 153 174 157 1410 82 16arrow_forwardThe following data was collected to explore how the average number of hours a student studies per night and the student's GPA affect their ACT score. The dependent variable is the ACT score, the first independent variable (x1) is the number of hours spent studying, and the second independent variable (x2) is the student's GPA. Effects on ACT Scores Study Hours GPA ACT Score 0 2 17 1 2 20 3 2 25 5 4 26 5 4 26 Copy Data Step 2 of 2: Determine if a statistically significant linear relationship exists between the independent and dependent variables at the 0.05 level of significance. If the relationship is statistically significant, identify the multiple regression equation that best fits the data, rounding the answers to three decimal places. Otherwise, indicate that there is not enough evidence to show that the relationship is statistically significant. Answer How to enter your answer (opens in new window) 2 Points Keypad Keyboard Shortcuts Selecting a checkbox will replace the entered…arrow_forwardCounty Hospitalizations Use variable Hospitalizations to perform the calculations. All results should be displayed in this column. Round your answer to zero decimal places. Dougherty 283 2.1 Compute 82nd percentile Cobb 431 2.2 Compute Q1 Hall 154 2.4 Compute 7th decile Clayton 113 2.5 Compute Software Coefficient of Skewness Unknown 115 Henry 54 Cherokee 71 Richmond 108 Sumter 87 Carroll 61 Lee 44 Mitchell 66 Bartow 116 Douglas 89 Muscogee 50 Forsyth 36 Bibb 64 Houston 73 Chatham 52 Upson 14 Early 9 Spalding 33 Coweta 32 Baldwin 39 Habersham 39 Colquitt 10 Fayette 28 Newton 30 Terrell 29 Rockdale 38 Paulding 48 Thomas 35 Randolph 21 Crisp 32 Columbia 23 Worth 28 Lowndes 25 Troup 39 Floyd 36 Clarke…arrow_forward
- Waiting times (in minutes) of customers at a bank where all customers enter a single waiting line and a bank where customers wait in individual lines at three different teller windows are listed below. Find the coefficient of variation for each of the two sets of data, then compare the variation. Bank A (single line): 6.4 6.7 6.7 6.8 7.1 7.3 7.3 7.6 7.7 7.7 o 4.3 5.3 5.9 6.3 6.7 7.6 7.8 8.5 9.3 9.8 Bank B (individual lines): The coefficient of variation for the waiting times at Bank A is %. (Round to one decimal place as needed.) The coefficient of variation for the waiting times at the Bank B is %. (Round to one decimal place as needed.) Is there a difference in variation between the two data sets? O A. There is no significant difference in the variations. O B. The waiting times at Bank B have considerably less variation than the waiting times at Bank A. O C. The waiting times at Bank A have considerably less variation than the waiting times at Bank B. Ansarrow_forwardD coefficient correlation please. Formula provided.arrow_forwardC. Describe the four characteristics of associationarrow_forward
- A study was done to look at the relationship between number of vacation days employees take each year and the number of sick days they take each year. The results of the survey are shown below. Vacation Days 5 15 13 3 9 0 3 7 7 14 4 Sick Days 5 5 1 5 4 9 9 6 5 3 9 Use the model to predict the number of sick days taken for an employee who took 3 vacation days this year.Sick Days = ? (Please round your answer to the nearest whole number.) Interpret the slope of the regression line in the context of the question: As x goes up, y goes down. The slope has no practical meaning since a negative number cannot occur with vacation days and sick days. For every additional vacation day taken, employees tend to take on average 0.40 fewer sick days. Interpret the y-intercept in the context of the question: The y-intercept has no practical meaning for this study. If an employee takes no vacation days, then that employee will take 8 sick days. The average number of sick days is…arrow_forwardWeight (lbs.) 173 184 194 214 168 220 188 188 207 167 217 Systolic Blood Pressure 132 143 153 162 154 168 137 149 159 128 1 1. The sample correlation coefficient is _____________arrow_forwardIn order to advise students properly, a college advisor is interested in the relationship between a student's GPA and the number of hours the student an average weck. The data are shown in the table. Study Time (in hours) 33 Student GPA 3.2 19 16 2.4 31 3.1 5. 24 2.7 28 2.9 7 1.7 34 3.3 14 2.2 10 35 3.4 11 1.8 Part 1 of 5 (a) Let I represent study time and let y nepresent GPA. Graph the points. Grade Point Average vs. Weekly Study Time Weckly Study Time (hours) Part 2 of 5 (b) Does there appear to be a linear trend? Yes Part: 2/5 Part 3 of 5 (c) use the data points (16, 2.4) and (34, 3 3) to find an eguation of the line through these points. Express numbers as decimas or integers. Write answer in slope-intercept form (y = MI+ b). The equation is GPAarrow_forward
- Waiting times (in minutes) of customers at a bank where all customers enter a single waiting line and a bank where customers wait in individual lines at three different teller windows are listed below. Find the coefficient of variation for each of the two sets of data, then compare the variation. Bank A (single line): 6.6 6.7 6.7 6.8 7.0 7.2 7.5 7.7 7.7 7.7 6.7 7.7 7.8 8.4 9.2 9.7 Bank B (individual 4.1 5.4 5.8 6.2 lines): www The coefficient of variation for the waiting times at Bank A is%. (Round to one decimal place as needed.)arrow_forwardA study was done to look at the relationship between number of movies people watch at the theater each year and the number of books that they read each year. The results of the survey are shown below. Movies 10 7 6 10 0 9 1 6 Books 0 0 -0 0 9 0 9 -0 Use the model to predict the number of books read per year for someone who watches 3 movies per year.Books per year = (Please round your answer to the nearest whole number.) Interpret the slope of the regression line in the context of the question: The slope has no practical meaning since people cannot read a negative number of books. As x goes up, y goes down. For every additional movie that people watch each year, there tends to be an average decrease of 0.98 books read. Interpret the y-intercept in the context of the question: The y-intercept has no practical meaning for this study. If someone watches 0 movies per year, then that person will read 8 books this year. The best prediction for a person who doesn't watch…arrow_forwardListed below are amounts (in millions of dollars) collected from parking meters by Brinks. Find coefficient of variation The data were provided by the attorney for New York City, and they are listed on the DASL Web site. Use s= 2.137 Collection contractor was Brinks: 71 66 72 69 68 69 Group of answer choices 3.1% 11.5% 1.5% 4.1%arrow_forward
arrow_back_ios
SEE MORE QUESTIONS
arrow_forward_ios
Recommended textbooks for you
 MATLAB: An Introduction with ApplicationsStatisticsISBN:9781119256830Author:Amos GilatPublisher:John Wiley & Sons Inc
 Probability and Statistics for Engineering and th...StatisticsISBN:9781305251809Author:Jay L. DevorePublisher:Cengage Learning
 Statistics for The Behavioral Sciences (MindTap C...StatisticsISBN:9781305504912Author:Frederick J Gravetter, Larry B. WallnauPublisher:Cengage Learning
 Elementary Statistics: Picturing the World (7th E...StatisticsISBN:9780134683416Author:Ron Larson, Betsy FarberPublisher:PEARSON
 The Basic Practice of StatisticsStatisticsISBN:9781319042578Author:David S. Moore, William I. Notz, Michael A. FlignerPublisher:W. H. Freeman
 Introduction to the Practice of StatisticsStatisticsISBN:9781319013387Author:David S. Moore, George P. McCabe, Bruce A. CraigPublisher:W. H. Freeman

MATLAB: An Introduction with Applications
Statistics
ISBN:9781119256830
Author:Amos Gilat
Publisher:John Wiley & Sons Inc

Probability and Statistics for Engineering and th...
Statistics
ISBN:9781305251809
Author:Jay L. Devore
Publisher:Cengage Learning

Statistics for The Behavioral Sciences (MindTap C...
Statistics
ISBN:9781305504912
Author:Frederick J Gravetter, Larry B. Wallnau
Publisher:Cengage Learning

Elementary Statistics: Picturing the World (7th E...
Statistics
ISBN:9780134683416
Author:Ron Larson, Betsy Farber
Publisher:PEARSON

The Basic Practice of Statistics
Statistics
ISBN:9781319042578
Author:David S. Moore, William I. Notz, Michael A. Fligner
Publisher:W. H. Freeman

Introduction to the Practice of Statistics
Statistics
ISBN:9781319013387
Author:David S. Moore, George P. McCabe, Bruce A. Craig
Publisher:W. H. Freeman