MATLAB: An Introduction with Applications
6th Edition
ISBN: 9781119256830
Author: Amos Gilat
Publisher: John Wiley & Sons Inc
expand_more
expand_more
format_list_bulleted
Question
thumb_up100%

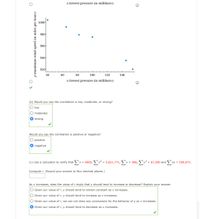
Transcribed Image Text:x (lowest pressure (in millibars))
1000
980
960
940
92아
40
60
80
100
120
140
x (lowest pressure (in millibars))
(b) Would you say the correlation is low, moderate, or strong?
O low
O moderate
O strong
Would you say the correlation is positive or negative?
O positive
negative
(c) Use a calculator to verify that x = 5805, x² = 5,621,771, y = 586, y² = 67,290 and
xy = 559,673.
Compute r. (Round your answer to four decimal places.)
As x increases, does the value of r imply that y should tend to increase or decrease? Explain your answer.
O Given our value of r, y should tend to remain constant as x increases.
O Given our value of r, y should tend to increase as x increases.
O Given our value of r, we can not draw any conclusions for the behavior of y as x increases.
O Given our value of r, y should tend to decrease as x increases.
y (maximum wind speed (in miles per hour))

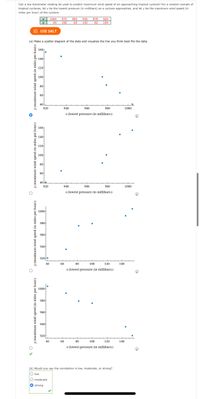
Transcribed Image Text:Can a low barometer reading be used to predict maximum wind speed of an approaching tropical cyclone? For a random sample of
tropical cyclones, let x be the lowest pressure (in millibars) as a cyclone approaches, and let y be the maximum wind speed (in
miles per hour) of the cyclone.
X 1004
975
992
65
935
145
979
920
154
y 40 100
82
A USE SALT
(a) Make a scatter diagram of the data and visualize the line you think best fits the data.
160.
& 140
120
100
80
60
40 E
920
940
960
980
1000
x (lowest pressure (in millibars))
160
140
120
100
80
60
40e
920
940
960
980
1000
x (lowest pressure (in millibars))
1000
980
960
940
920
40
60
80
100
120
140
x (lowest pressure (in millibars))
* 1000
980
960
940
920
40
60
80
100
120
140
x (lowest pressure (in millibars))
(b) Would you say the correlation is low, moderate, or strong?
O low
O moderate
O strong
wind speed (in miles per hour)
y (maximum wind speed (in miles per hour)
((anoy Jad saru ut) paads putM unupxeur)
Expert Solution
This question has been solved!
Explore an expertly crafted, step-by-step solution for a thorough understanding of key concepts.
This is a popular solution
Trending nowThis is a popular solution!
Step by stepSolved in 2 steps with 6 images

Knowledge Booster
Similar questions
- Data was collected for 300 fish from the North Atlantic. The length of the fish (in mm) is summarized in the GFDT below. Lengths (mm) Frequency 160 - 169 1 170 - 179 16 180 - 189 71 190 - 199 108 200 - 209 83 210 - 219 18 220 - 229 3 What is the class midpoint for the sixth class?class midpoint =arrow_forwardThe accompanying data table contains the prices and weights of the diamonds in 10 rings offered for sale. The prices are 4 carats an Xough d belo Data (Daund both The weight in carats and price in dollars for 10 diamond rings Weight 0.29 0.32 0.34 0.17 0.36 0.36 0.12 0.14 0.23 0.26 Price 924 881 1,039 445 1,073 1,034 120 320 665 733 Print Done - rings. ble.arrow_forwardWeight (lbs.) 173 184 194 214 168 220 188 188 207 167 217 Systolic Blood Pressure 132 143 153 162 154 168 137 149 159 128 1 1. The sample correlation coefficient is _____________arrow_forward
- Data was collected for 300 fish from the North Atlantic. The length of the fish (in mm) is summarized in the GFDT below. Lengths (mm) Frequency 180 - 184 1 185 - 189 16 190 - 194 71 195 - 199 108 200 - 204 83 205 - 209 18 210 - 214 3 What is the lower class limit for the sixth class?lower class limit =arrow_forwardData was collected for 300 fish from the North Atlantic. The length of the fish (in mm) is summarized in the GFDT below. Lengths (mm) Frequency 160 - 162 1 163 - 165 16 166 - 168 71 169 - 171 108 172 - 174 83 175 - 177 18 178 - 180 3 What is the class midpoint for the sixth class?class midpoint =arrow_forwardData was collected for 300 fish from the North Atlantic. The length of the fish (in mm) is summarized in the GFDT below. Lengths (mm) Frequency 140 - 159 1 160 - 179 16 180 - 199 71 200 - 219 108 220 - 239 83 240 - 259 18 260 - 279 3 What is the lower class boundary for the first class?class boundary =arrow_forward
- A 1982 paper by Hans Rosendal and Samuel Shaw established a correlation between the maximum sustained surface wind speeds to the minimum sea level pressure in central north pacific cyclones. Use the following data below to test this result. Minimum Sea Level Pressure (in millibars) (x) Surface Wind Speed (in knots) (y) 968 89 1022 42 1012 72 931 130 984 73 992 97 942 121 974 77 1008 93 939 126 956 115 1014 86 Calculate the correlation coefficient. Round to three decimals Find the equation of the regression line. Round each value to two decimals Preview New data has just arrived indicating that the minimum sea level pressure for a storm is 955 millibars. Predict the maximum sustained wind speed in knots. Round your answer to the nearest integerarrow_forwardaChen -. M Gmail YouTube Maps oscar - Google D... Translate New Tab ece Gler 2/6 100% SID: 2. A researcher is studying the relationship between various properties of wine and their taste characteristics. The histogram below shows the amount of residual sugar (sugar left after fermentation) in a collection of wines. However, one of the bars, between 3 and 5 grams per liter, is missing. 50 (47.9) (38.7) 30 10 (0.1) (0.92) (0.1) 2 10 15 Residual sugar (grams/liter) Calculate the height of the missing bar and draw it in. (Show your work below, and indicate the numerical value in parentheses above the bar.) % per gramlterarrow_forwardData was collected for 300 fish from the North Atlantic. The length of the fish (in mm) is summarized in the GFDT below. Lengths (mm) Frequency 40 - 54 1 55 - 69 16 70 - 84 71 85 - 99 108 100 - 114 83 115 - 129 18 130 - 144 3 What is the class boundary between the sixth and seventh classes?class boundary =arrow_forward
- 15. Diameter of Douglas Fir Trees The diameter of the Douglas fir tree is measured at a height of 1.37 meters. The S following data represent the diameter in centimeters of a random sample of 12 Douglas firs in the western Washington Cascades. 156 162 147 173 147 190 130 101 159 113 181 109 Source: L. Winter. "Live Tree and Tree-Ring Records to Reconstruct the Structural Development of an Old-Growth Douglas Fir/Western Hemlock Stand in the Western Washington Cascades." Corvallis, OR: Forest Science Data Bank, 2005. (a) Obtain a point estimate for the mean and standard deviation diameter of a Douglas fir tree in the western Washington Cascades. (b) Because the sample size is small, we must verify that the data come from a population that is normally distributed and that the data do not contain any outliers. The figures show the normal probability plot and boxplot. The correlation between the tree diameters and expected z-scores is 0.982. Use Option 1 or Option 2 to determine if the…arrow_forwardWhich scatter plot shown has a correlation coefficient, r, closest to 0?arrow_forwardA sample of blood pressure measurements is taken for a group of adults, and those values (mm Hg) are listed below. The values are matched so that 10 subjects each have a systolic and diastolic measurement. Find the coefficient of variation for each of the two samples; then compare the variation. Systolic 119 129 160 97 154 122 117 137 125 118 D Diastolic 80 74 73 54 88 90 58 66 71 81 The coefficient of variation for the systolic measurements is %. (Type an integer or decimal rounded to one decimal place as needed.) The coefficient of variation for the diastolic measurements is %. (Type an integer or decimal rounded to one decimal place as needed.) Compare the variation. The coefficients of variation for each data set are Therefore, the systolic measurements vary V the diastolic measurements.arrow_forward
arrow_back_ios
SEE MORE QUESTIONS
arrow_forward_ios
Recommended textbooks for you
 MATLAB: An Introduction with ApplicationsStatisticsISBN:9781119256830Author:Amos GilatPublisher:John Wiley & Sons Inc
 Probability and Statistics for Engineering and th...StatisticsISBN:9781305251809Author:Jay L. DevorePublisher:Cengage Learning
 Statistics for The Behavioral Sciences (MindTap C...StatisticsISBN:9781305504912Author:Frederick J Gravetter, Larry B. WallnauPublisher:Cengage Learning
 Elementary Statistics: Picturing the World (7th E...StatisticsISBN:9780134683416Author:Ron Larson, Betsy FarberPublisher:PEARSON
 The Basic Practice of StatisticsStatisticsISBN:9781319042578Author:David S. Moore, William I. Notz, Michael A. FlignerPublisher:W. H. Freeman
 Introduction to the Practice of StatisticsStatisticsISBN:9781319013387Author:David S. Moore, George P. McCabe, Bruce A. CraigPublisher:W. H. Freeman

MATLAB: An Introduction with Applications
Statistics
ISBN:9781119256830
Author:Amos Gilat
Publisher:John Wiley & Sons Inc

Probability and Statistics for Engineering and th...
Statistics
ISBN:9781305251809
Author:Jay L. Devore
Publisher:Cengage Learning

Statistics for The Behavioral Sciences (MindTap C...
Statistics
ISBN:9781305504912
Author:Frederick J Gravetter, Larry B. Wallnau
Publisher:Cengage Learning

Elementary Statistics: Picturing the World (7th E...
Statistics
ISBN:9780134683416
Author:Ron Larson, Betsy Farber
Publisher:PEARSON

The Basic Practice of Statistics
Statistics
ISBN:9781319042578
Author:David S. Moore, William I. Notz, Michael A. Fligner
Publisher:W. H. Freeman

Introduction to the Practice of Statistics
Statistics
ISBN:9781319013387
Author:David S. Moore, George P. McCabe, Bruce A. Craig
Publisher:W. H. Freeman