
ENGR.ECONOMIC ANALYSIS
14th Edition
ISBN: 9780190931919
Author: NEWNAN
Publisher: Oxford University Press
expand_more
expand_more
format_list_bulleted
Related questions
Question
Note:-
- Do not provide handwritten solution. Maintain accuracy and quality in your answer. Take care of plagiarism.
- Answer completely.
- You will get up vote for sure.
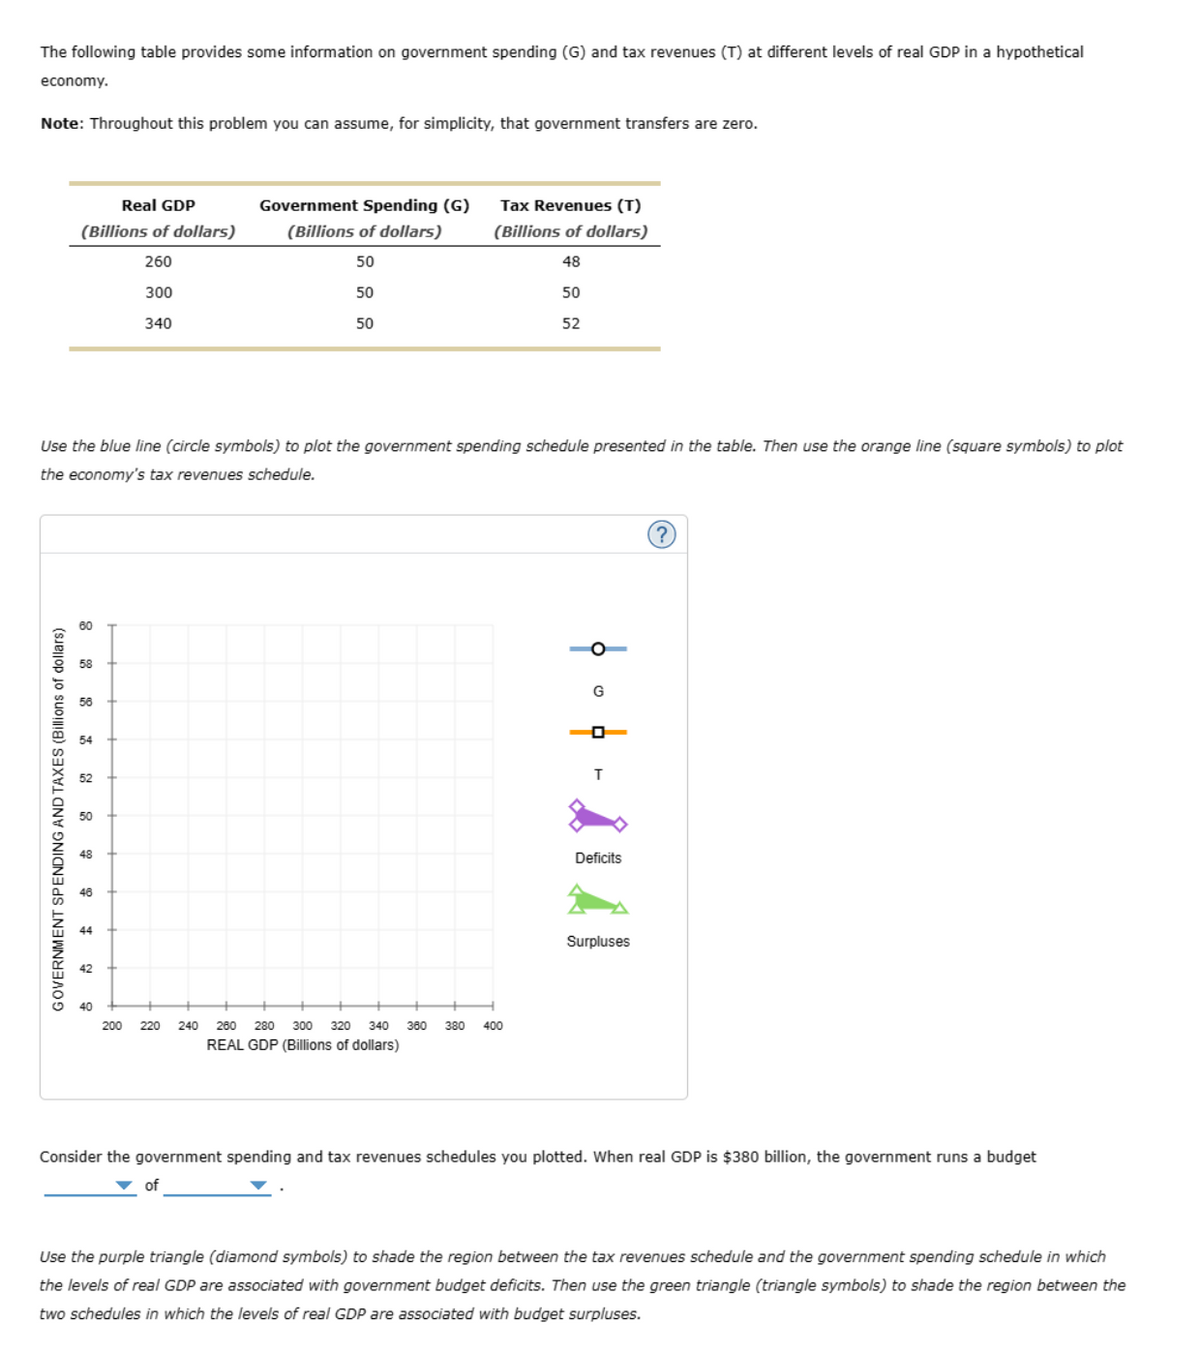

Transcribed Image Text:The following table provides some information on government spending (G) and tax revenues (T) at different levels of real GDP in a hypothetical
economy.
Note: Throughout this problem you can assume, for simplicity, that government transfers are zero.
Real GDP
(Billions of dollars)
Government Spending (G)
Tax Revenues (T)
(Billions of dollars)
(Billions of dollars)
260
50
48
300
50
50
340
50
52
Use the blue line (circle symbols) to plot the government spending schedule presented in the table. Then use the orange line (square symbols) to plot
the economy's tax revenues schedule.
GOVERNMENT SPENDING AND TAXES (Billions of dollars)
8
48
46
200 220 240 260 280 300 320 340 360 380 400
REAL GDP (Billions of dollars)
G
T
Deficits
Surpluses
Consider the government spending and tax revenues schedules you plotted. When real GDP is $380 billion, the government runs a budget
of
Use the purple triangle (diamond symbols) to shade the region between the tax revenues schedule and the government spending schedule in which
the levels of real GDP are associated with government budget deficits. Then use the green triangle (triangle symbols) to shade the region between the
two schedules in which the levels of real GDP are associated with budget surpluses.
Expert Solution
This question has been solved!
Explore an expertly crafted, step-by-step solution for a thorough understanding of key concepts.

Step by stepSolved in 3 steps with 2 images

Knowledge Booster


Learn more about
Need a deep-dive on the concept behind this application? Look no further. Learn more about this topic, economics and related others by exploring similar questions and additional content below.Similar questions
- Note:- Do not provide handwritten solution. Maintain accuracy and quality in your answer. Take care of plagiarism. Answer completely. You will get up vote for sure.arrow_forwardWhat are the Different Techniques to compare multiple alternatives?arrow_forwardNote:- Do not provide handwritten solution. Maintain accuracy and quality in your answer. Take care of plagiarism. Answer completely. You will get up vote for sure.arrow_forward
- I will be analyze the Ghana economy, currency, social and ethnic concerns, and ethical and legal challenges. The student will include a short study of a prominent woman (political, social, arts, entertainment, business) in the country’s history. What Corporation do you think should expend their busniess in Ghana?arrow_forwardNote:- Do not provide handwritten solution. Maintain accuracy and quality in your answer. Take care of plagiarism.Answer completely.You will get up vote for sure.arrow_forwardplease help Note:- Do not provide handwritten solution. Maintain accuracy and quality in your answer. Take care of plagiarism. Answer completely. You will get up vote for surearrow_forward
- Note:- Do not provide handwritten solution. Maintain accuracy and quality in your answer. Take care of plagiarism. Answer completely. You will get up vote for sure.arrow_forwardIf a consumer's Engle curve for a certain product is downward sloping then (a) the product must be a normal good. (b) the product must be an inferior good. (c) the product must be a bad. (d) the product must be a neuter. +arrow_forwardPLS HELP ASAParrow_forward
arrow_back_ios
SEE MORE QUESTIONS
arrow_forward_ios
Recommended textbooks for you
 Principles of Economics (12th Edition)EconomicsISBN:9780134078779Author:Karl E. Case, Ray C. Fair, Sharon E. OsterPublisher:PEARSON
 Engineering Economy (17th Edition)EconomicsISBN:9780134870069Author:William G. Sullivan, Elin M. Wicks, C. Patrick KoellingPublisher:PEARSON
 Principles of Economics (MindTap Course List)EconomicsISBN:9781305585126Author:N. Gregory MankiwPublisher:Cengage Learning
 Managerial Economics: A Problem Solving ApproachEconomicsISBN:9781337106665Author:Luke M. Froeb, Brian T. McCann, Michael R. Ward, Mike ShorPublisher:Cengage Learning
 Managerial Economics & Business Strategy (Mcgraw-...EconomicsISBN:9781259290619Author:Michael Baye, Jeff PrincePublisher:McGraw-Hill Education
Principles of Economics (12th Edition)
Economics
ISBN:9780134078779
Author:Karl E. Case, Ray C. Fair, Sharon E. Oster
Publisher:PEARSON
Engineering Economy (17th Edition)
Economics
ISBN:9780134870069
Author:William G. Sullivan, Elin M. Wicks, C. Patrick Koelling
Publisher:PEARSON
Principles of Economics (MindTap Course List)
Economics
ISBN:9781305585126
Author:N. Gregory Mankiw
Publisher:Cengage Learning
Managerial Economics: A Problem Solving Approach
Economics
ISBN:9781337106665
Author:Luke M. Froeb, Brian T. McCann, Michael R. Ward, Mike Shor
Publisher:Cengage Learning
Managerial Economics & Business Strategy (Mcgraw-...
Economics
ISBN:9781259290619
Author:Michael Baye, Jeff Prince
Publisher:McGraw-Hill Education