MATLAB: An Introduction with Applications
6th Edition
ISBN: 9781119256830
Author: Amos Gilat
Publisher: John Wiley & Sons Inc
expand_more
expand_more
format_list_bulleted
Question

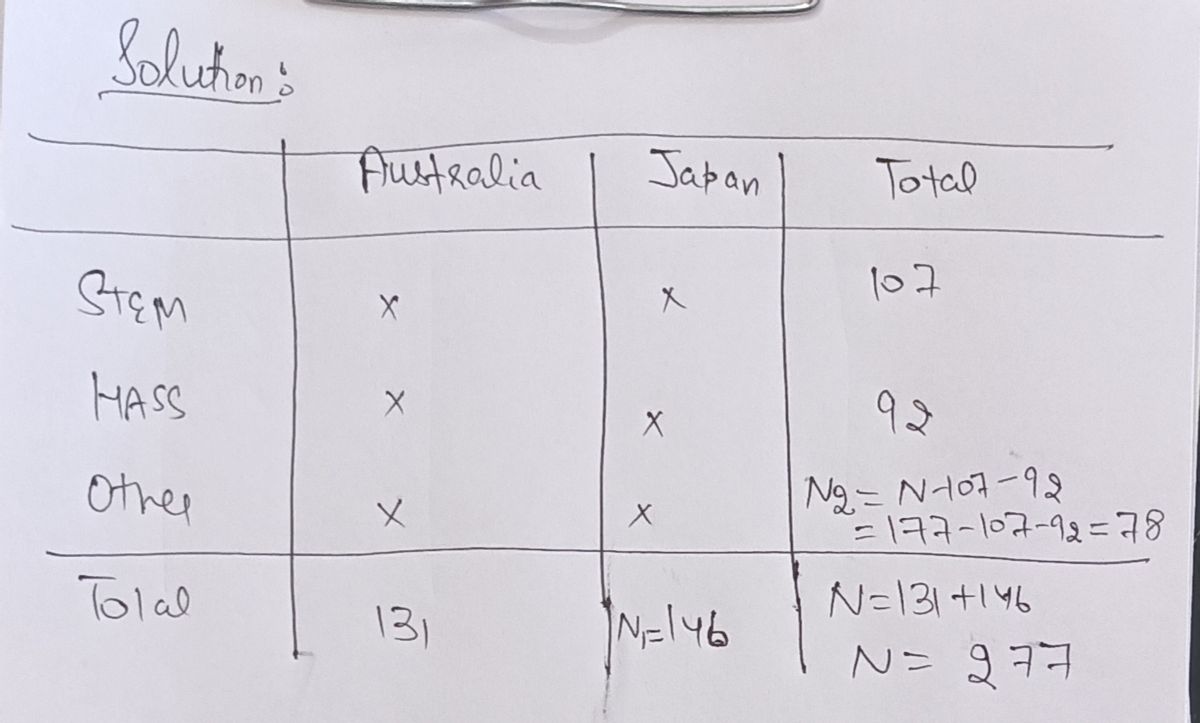
Transcribed Image Text:The following table gives partial output of a survey involving students in Australia and Japan. It contains the number of students pursing STEM, HASS and
Other studies as their undergraduate degree in both countries. Some sub-totals are given. Each X denotes an unknown value. The value of each X may
be different,
Australia
|Jаpan
Total
STEM
X
X
107
HASS
X
92
Other
X
Total
131
146
You are performing a Chi Square test for homogeneity, that is you're testing if the proportions across different populations are equal. If the proportions
across the two countries are the same, what is the expected value of students doing Other studies in Japan? Give your answer to 2 decimal
places.
Expert Solution
arrow_forward
Step 1
Solution

Step by stepSolved in 2 steps with 2 images

Knowledge Booster
Similar questions
- Blank are more representative of a population, but blank are easier to obtainarrow_forwardThe least-squares regression equation is y=761.7x+13,208 where y is the median income and x is the percentage of 25 years and older with at least a bachelor's degree in the region. The scatter diagram indicates a linear relation between the two variables with a correlation coefficient of 0.7483. Predict the median income of a region in which 20% of adults 25 years and older have at least a bachelor's degree.arrow_forwardSuppose that a polling company surveyed 600 people about how much time they spend watching television each day. The results of this survey were compiled and used to create this relative frequency histogram. Assume that all percentages shown in the histogram are whole numbers. Each of the bars in this histogram includes only the left endpoint of the class except for the last bar, which also includes the right endpoint. What percentage of respondents said that they watch television at least six hours per day? How many respondents said that they watch television between three and five hours per day?arrow_forward
- Please no written by hand and no emage The National Assessment for Educational Progress (NAEP) is a U.S. government organization that assesses the performance of students and schools at all levels across the United States. The following table presents the percentage of eighth-grade students who were found to be proficient in mathematics and the percentage who were found to be proficient in reading in each of the ten most populous states. Use excels to find: StatePercentage Proficient in ReadingPercentage Proficient in MathematicsCalifornia6059Texas7378New York7570Florida6668Illinois7570Pennsylvania7977Ohio7976Michigan7366Georgia6764North Carolina7173 Activities: Construct a scatterplot with reading proficiency on the horizontal axis and math proficiency on the vertical axis. Is there a linear relationship? Compute the correlation between reading proficiency and math proficiency. Is the linear association positive or negative? Weak or strong?arrow_forwardCreate and fill in a table with columns for (1) bin, (2) absolute frequency, and (3) relative frequency. Draw a histogram of the relative frequency distribution of Commuting Time in your sample. How would you characterize the shape of your histogram (e.g. uniform, symmetric, etc.)?arrow_forwardPlease box every answrarrow_forward
- A recent poll of 2940 corporate executives showed that the average price of their cars is $31,800 is this a population parameter or a sample statstic and why?arrow_forwardPLEASE ANSWER ALL THE PARTS OF THE QUESTION ( THIS IS NOT A GRADED ASSIGNMENT)arrow_forwardWrite an example of a research study that would be most appropriate for a within subjects ANOVAarrow_forward
- Florida State University has 14 statistics classes scheduled for its Summer 2013 term. One class has space available for 30 students, eight classes have space for 60 students, one class has space for 70 students, and four classes have space for 100 students. Find the mean of X (Round to 2 decimal places)arrow_forwardA record of a chess match records the chess piece used, the location of the piece and the length of time used to make the move. Classify each variable as qualitative or quantitative. A sample data table is listed below Piece Location pawn B3 rook C7 queen A6 0000 Move time (in seconds) 65 84 53 Piece - qualitative; location - quantitative; move time - quantitative Piece - quantitative; location - quantitative; move time - qualitative Piece - qualitative; location - qualitative; move time - quantitative Piece - qualitative; location - quantitative; move time - qualitativearrow_forward
arrow_back_ios
arrow_forward_ios
Recommended textbooks for you
 MATLAB: An Introduction with ApplicationsStatisticsISBN:9781119256830Author:Amos GilatPublisher:John Wiley & Sons Inc
 Probability and Statistics for Engineering and th...StatisticsISBN:9781305251809Author:Jay L. DevorePublisher:Cengage Learning
 Statistics for The Behavioral Sciences (MindTap C...StatisticsISBN:9781305504912Author:Frederick J Gravetter, Larry B. WallnauPublisher:Cengage Learning
 Elementary Statistics: Picturing the World (7th E...StatisticsISBN:9780134683416Author:Ron Larson, Betsy FarberPublisher:PEARSON
 The Basic Practice of StatisticsStatisticsISBN:9781319042578Author:David S. Moore, William I. Notz, Michael A. FlignerPublisher:W. H. Freeman
 Introduction to the Practice of StatisticsStatisticsISBN:9781319013387Author:David S. Moore, George P. McCabe, Bruce A. CraigPublisher:W. H. Freeman

MATLAB: An Introduction with Applications
Statistics
ISBN:9781119256830
Author:Amos Gilat
Publisher:John Wiley & Sons Inc

Probability and Statistics for Engineering and th...
Statistics
ISBN:9781305251809
Author:Jay L. Devore
Publisher:Cengage Learning

Statistics for The Behavioral Sciences (MindTap C...
Statistics
ISBN:9781305504912
Author:Frederick J Gravetter, Larry B. Wallnau
Publisher:Cengage Learning

Elementary Statistics: Picturing the World (7th E...
Statistics
ISBN:9780134683416
Author:Ron Larson, Betsy Farber
Publisher:PEARSON

The Basic Practice of Statistics
Statistics
ISBN:9781319042578
Author:David S. Moore, William I. Notz, Michael A. Fligner
Publisher:W. H. Freeman

Introduction to the Practice of Statistics
Statistics
ISBN:9781319013387
Author:David S. Moore, George P. McCabe, Bruce A. Craig
Publisher:W. H. Freeman