
Related questions
Concept explainers
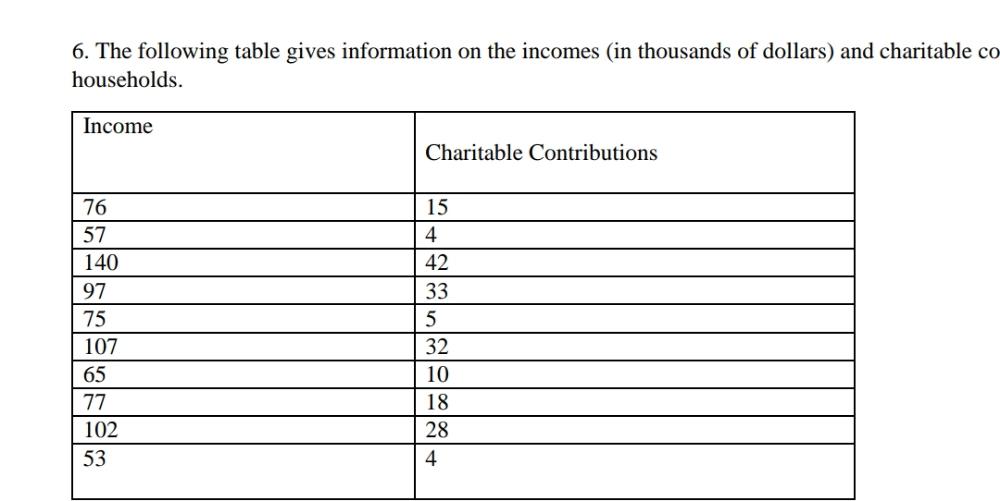
The following table gives information on the incomes (in thousands of dollars) and charitable contributions (in hundreds of dollars) for the last year for a random sample of 10 Households.
a. With income as an independent variable and charitable contributions as a dependent variable, compute SSxx, SSyy, and SSxy.
b. Find the regression of charitable contributions on income.
c. Briefly explain the meaning of the values of a and b.
d. Calculate r and r2 and briefly explain what they mean.
e. Compute the standard deviation of errors.
f. Construct a 99% confidence interval for B.
g. Test at the 1% significance level whether B is positive.
h. Using the 1% significance level, can you conclude that the linear
7. Briefly explain the difference between estimating the mean value of y and predicting a particular value of y using a regression model.


Step by stepSolved in 3 steps with 1 images


- Listed below are paired data consisting of movie budget amounts and the amounts that the movies grossed. Find the regression equation, letting the budget be the predictor (x) variable. Find the best predicted amount that a movie will gross if its budget is $110 million. Use a significance level of alpha equals 0.05 . Budget left parenthesis $ right parenthesis in Millions 42 24 119 69 77 48 121 62 5 63 129 21 12 154 4 Gross left parenthesis $ right parenthesis in Millions 117 16 112 66 111 111 104 90 62 104 219 27 20 288 42 The regression equation is ŷ = __ + __x. (Round to one decimal place as needed.) The linear coefficient of correlation r = ___ (Round to three decimal places as needed.) The critical value of r = ____ The best predicted gross for a move with a $110 million budget is _____.arrow_forwardUse the scatterplot of Vehicle Registrations below to answer the questions Vehicle Registrations in the United States, 1925- 2011 Vehicles millions 300 y = 3.0161x - 5819.5 R? = 0.9695 250 200 150 100 50 1920 -50 1940 1960 1980 2000 2020 Year Write a sentence explaining the value of the slope for this regression line. For every increase in year, the number of vehicle registrations in the US increases by 3.0161 million. For every increase in year, the number of vehicle registrations in the US increases by 5819.5. For every increase in vehicle registrations in the US, the number of years increases by 5819.5. For every increase in vehicle registrations in the US, the number of years increases by 3.0161 million. Registrations (in millions)arrow_forwardPa.n.narrow_forward
- Body Fat. Where we considered the regression of percentage of body fat on nine body measurements: height, weight, hip, forearm, neck, wrist, triceps, scapula, and sup. Describe and discuss problems that could have arisen in the collection of the data for this regression analysis.arrow_forward9. Find the equation of the regression line for the given data. Then construct a scatter plot of the data and draw the regression line. (Each pair of variables has a significant correlation.) Then use the regression equation to predict the value of y for each of the given x-values, if meaningful. The caloric content and the sodium content (in milligrams) for 6 beef hot dogs are shown in the table below. Calories, x Sodium, y 160 130 330 120 70 190 (a) x = 170 calories (c) x = 150 calories 180 (b) x = 80 calories 420 470 360 250 530 (d) x = 210 calories Find the regression equation. x+( (Round to three decimal places as needed.) y = Choose the correct graph below. OA. О В. OC. OD. 560- 560 560 560- 200 G 0IN T> 200 200 Calories Calories Calories Calories (a) Predict the value of y for x = 170. Choose the correct answer below. O A. 411.632 O B. 543.752 O C. 455.672 O D. not meaningful (b) Predict the value of y for x = 80. Choose the correct answer below. O A. 411.632 О В. 257.492 O C.…arrow_forwardThe following data represent the number of flash drives sold per day at a localcomputer shop and their prices.Price Units Sold34 336 432 635 530 938 240 1a. Develop the estimated regression equation that could be used to predict thequantity sold given the price. Interpret the slope.b. Did the estimated regression equation provide a good fit? Explain.c. Compute the sample correlation coefficient between the price and the number offlash drives sold. Use a= 0.01 to test the relationship between price and units sold.d. How many units can be sold per day if the price of flash drive is set to $28.arrow_forward
- Find the equation of the regression line for the given data. Then construct a scatter plot of the data and draw the regression line. (The pair of variables have a significant correlation.) Then use the regression equation to predict the value of y for each of the given x-values, if meaningful. The table below shows the heights (in feet) and the number of stories of six notable buildings in a city.arrow_forwardListed below are paired data consisting of movie budget amounts and the amounts that the movies grossed. Find the regression equation, letting the budget be the predictor (x) variable. Find the best predicted amount that a movie will gross if its budget is $140 million. Use a significance level of a = 0.05. Budget ($)in Millions Gross ($) in Millions 39 22 118 67 77 49 124 66 12 64 128 19 6. 147 9. 118 6. 99 75 127 107 95 99 64 109 209 44 8 293 48 Click the icon to view the critical values of the Pearson correlation coefficient r. The regression equation is y =+x. (Round to one decimal place as needed.)arrow_forwardIs there a relationship between the weight and price of a mountain bike? The following data set gives the weights and prices for ten mountain bikes. Let the expanatory variable x be the weight in pounds and the response variable y be the bike's price. Weight (LB) 32 33 29 29 34 37 28 30 34 30 Price ($) 980 350 430 710 930 160 590 530 180 1090 a. Construct a scatterplot. Interpret. b. Find the regression equation. Interpret the slope in context. Does the y-intercept have contextual meaning? c. You decide to purchase a mountain bike that weighs 33 pounds. What is the predicted price for the bike? a. Which scatterplot below correctly shows the data? A. 254001200xy A coordinate system has a horizontal x-axis labeled from 25 to 40 in increments of 1 and a vertical y-axis labeled from 0 to 1200 in increments of 50. A cluster of plotted points that form a line that falls from left to…arrow_forward
- The accompanying table shows a portion of data that refers to the property taxes owed by a homeowner (in $) and the size of the home (in square feet) in an affluent suburb 30 miles outside New York City. Click here for the Excel Data File Taxes Size 21,987 2,403 17,353 2,451 29,238 2,866 a. Estimate the sample regression equation that enables us to predict property Taxes on the basis of the size of the home. (Round your answers to 2 decimal places.) Taxes = + Size. b. Interpret the slope coefficient. O As Property Taxes increase by 1 dollar, the size of the house increases by 6.71 ft. O As Size increases by 1 square foot, the property taxes are predicted to increase by $6.71. c. Predict the property Taxes for a 1,400-square-foot home. (Round coefficient estimates to at least 4 decimal places and final answer to 2 decimal places.) Taxesarrow_forwardListed below are paired data consisting of movie budget amounts and the amounts that the movies grossed. Find the regression equation, letting the budget be the predictor (x) variable. Find the best predicted amount that a movie will gross if its budget is $135 million. Use a significance level of alpha equals 0.05 . Budget left parenthesis $ right parenthesis in Millions 45 24 115 74 72 48 117 67 4 60 124 24 6 152 8 Gross left parenthesis $ right parenthesis in Millions 115 10 95 69 127 112 93 101 50 102 223 26 18 282 56 The regression equation is ŷ = __ + __x. (Round to one decimal place as needed.)arrow_forwardListed below are paired data consisting of movie budget amounts and the amounts that the movies grossed. Find the regression equation, letting the budget be the predictor (x) variable. Find the best predicted amount that a movie will gross if its budget is $105 million. Use a significance level of a = 0.05. Budget ($)in Millions Gross ($) in Millions 41 23 114 75 78 47 120 64 10 59 127 22 12 150 2 0 127 18 111 65 113 112 102 94 64 98 211 41 22 288 57 Click the icon to view the critical values of the Pearson correlation coefficient r. ..... x. (Round to one decimal place as needed.) The regression equation is = + The best predicted gross for a movie with a $105 million budget is $ million. (Round to one decimal place as needed.)arrow_forward
- MATLAB: An Introduction with ApplicationsStatisticsISBN:9781119256830Author:Amos GilatPublisher:John Wiley & Sons Inc
 Probability and Statistics for Engineering and th...StatisticsISBN:9781305251809Author:Jay L. DevorePublisher:Cengage Learning
 Statistics for The Behavioral Sciences (MindTap C...StatisticsISBN:9781305504912Author:Frederick J Gravetter, Larry B. WallnauPublisher:Cengage Learning
  Elementary Statistics: Picturing the World (7th E...StatisticsISBN:9780134683416Author:Ron Larson, Betsy FarberPublisher:PEARSON
 The Basic Practice of StatisticsStatisticsISBN:9781319042578Author:David S. Moore, William I. Notz, Michael A. FlignerPublisher:W. H. Freeman
 Introduction to the Practice of StatisticsStatisticsISBN:9781319013387Author:David S. Moore, George P. McCabe, Bruce A. CraigPublisher:W. H. Freeman