
FINANCIAL ACCOUNTING
10th Edition
ISBN: 9781259964947
Author: Libby
Publisher: MCG
expand_more
expand_more
format_list_bulleted
Related questions
Concept explainers
Topic Video
Question
please answer all requirements with all working answer in text please
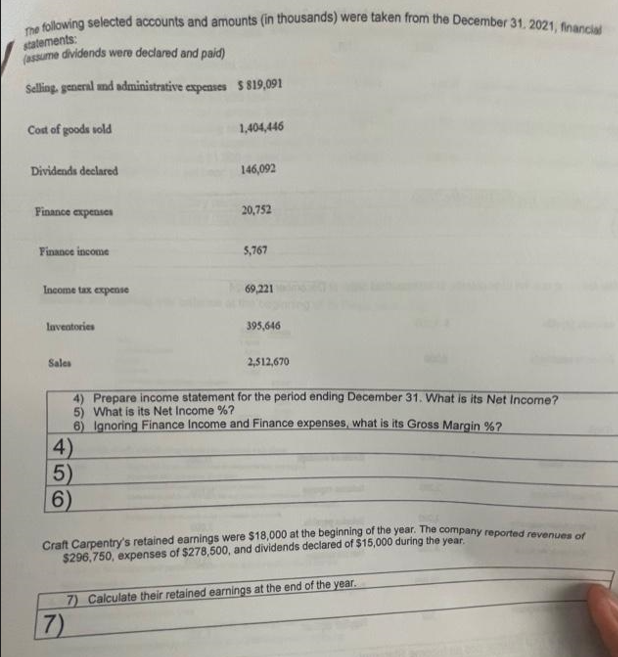

Transcribed Image Text:The following selected accounts and amounts (in thousands) were taken from the December 31, 2021, financial
statements:
(assume dividends were declared and paid)
Selling, general and administrative expenses $819,091
Cost of goods sold
Dividends declared
Finance expenses
Finance income
Income tax expense
Inventories
Sales
4)
5)
1,404,446
6)
146,092
20,752
5,767
69,221
2,512,670
4) Prepare income statement for the period ending December 31. What is its Net Income?
5) What is its Net Income %?
6) Ignoring Finance Income and Finance expenses, what is its Gross Margin %?
395,646
Craft Carpentry's retained earnings were $18,000 at the beginning of the year. The company reported revenues of
$296,750, expenses of $278,500, and dividends declared of $15,000 during the year.
7) Calculate their retained earnings at the end of the year.
7)
Expert Solution
This question has been solved!
Explore an expertly crafted, step-by-step solution for a thorough understanding of key concepts.

Step by stepSolved in 5 steps

Knowledge Booster


Learn more about
Need a deep-dive on the concept behind this application? Look no further. Learn more about this topic, accounting and related others by exploring similar questions and additional content below.Similar questions
- Complete a Vertical analysis of the "Unearned revenue" account using the balance sheet as at 30/06/2021. Round the percentage change to one decimal placearrow_forwardThe following information relates to SE10-5 through SE10-7: (in millions) Net sales... Cost of goods sold SE10-7. Gross profit. Selling and administrative expenses Income from operations Interest expense.. EVANS & SONS, INC. Income Statement For Years Ended December 31, 2019 and 2018 Income before income taxes Income tax expense. Net income (in millions) Assets Current assets Cash and cash equivalents Accounts receivable Inventory.. Other current assets. Total current assets Property, plant, & equipment (net) Other assets. Total Assets Liabilities and Stockholders' Equity Current liabilities. Long-term liabilities. Total liabilities.. EVANS & SONS, INC. Balance Sheet December 31, 2019 and 2018 Stockholders' equity - common. Total Liabilities and Stockholders' Equity.. 2019 9,800 (5,500) 4,300 (2,800) 1,500 (300) $ 1,200 2019 100 900 500 400 2018 1,900 2,600 5,700 $10,200 9,300 (5,200) 4,100 (2,700) (220) (200) $980 $950 1,400 $ (250) 1,150 2018 300 800 650 250 2,000 2,500 5,900 $10,400…arrow_forwardThe following financial information is for Annapolis Corporation for the fiscal years ending 2018 and 2019 (all balances are normal): Cost of Accounts Net Sales Net Item/Account Inventory Goods Receivable (all credit) Income Sold 2019 2018 $44,000 $42,000 $410,000 $154,000 $27,200 $34,000 $38,000 $350,000 $152,000 $24,800 Use this information to determine the accounts receivable average collection period for FY 2019. (Use 365 days a year. Round your answers to one decimal place.)arrow_forward
- The following selected account balances were taken from Buckeye Company's general ledger at January 1, 2019 and December 31, 2022: Accounts receivable Inventory Sales revenue Cost of goods sold January 1 $126,000 $163,000 The following information was taken from Buckeye Company's 2022 income statement: Salaries expense Income tax expense Net income December 31 $139,000 131,000 $967,250 $429, 240 $211,390 $ 97,986 $228,634 Calculate the average number of days that elapse between Buckeye Company buying their inventory from suppliers and then selling the inventory to customers.arrow_forwardPlease provide correct answer accounting questionarrow_forwardThe following information is from the accounts of Neway Ltd for the years 2018 and 2019 Neway Ltd Summary of the statement of comprehensive income 2019 2018 $m $m Sales revenue 650 615 COGS 305 295 Gross profit Interest expense Other expenses (including depreciation) Profit 320 (13) (100) 345 (15) (120) 210 207 63 Depreciation expense Accounts payable at the end of the period Accounts receivable at the end of the period |Inventory held at the end of the period 85 30 25 34 46 65 57 Required: a) Prepare a statement of cash flows from operations for Neway Ltd. b) Prepare a statement that reconciles the profit with the cash flows from operations.arrow_forward
- Problem 13-2A (Algo) Ratios, common-size statements, and trend percents LO P1, P2, P3 [The following information applies to the questions displayed below] Selected comparative financial statements of Korbin Company follow. KORBIN COMPANY Comparative Income Statements For Years Ended December 31 2021 2020 2019 Sales Cost of goods sold $ 402,346 $ 308,230 242,212 $ 213,900 194,493 136,896 Gross profit 160,134 113,737 77,004 Selling expenses 57,133 42,536 28,235 Administrative expenses 36,211 27,124 17,754 Total expenses 93,344 69,660 45,989 Income before taxes Income tax expense 66,790 44,077 31,015 12,423 9,036 6,296 Net income $ 54,367 $ 35,041 $ 24,719 KORBIN COMPANY Comparative Balance Sheets December 31 Assets Current assets Long-term investments Plant assets, net Total assets Current liabilities Liabilities and Equity Common stock Other paid-in capital Retained earnings Total liabilities and equity $ 180,932 2021 $ 63,959 116,973 0 2020 $ 42,808 800 106,691 $ 180,932 $ 150,299 $…arrow_forwardOn June 30, 2021, Streeter Company reported the following account balances: Receivables Inventory Buildings (net) Equipment (net) Total assets $ 88,200 Current liabilities 75,250 Long-term liabilities 87,500 Common stock 29,400 Retained earnings $ 280,350 Total liabilities and equities $ (16,100) (74,250) (90,000) (100,000) $ (280,350) On June 30, 2021, Princeton Company paid $315,200 cash for all assets and liabilities of Streeter, which will cease to exist as a separate entity. In connection with the acquisition, Princeton paid $19,900 in legal fees. Princeton also agreed to pay $66,400 to the former owners of Streeter contingent on meeting certain revenue goals during 2022. Princeton estimated the present value of its probability adjusted expected payment for the contingency at $23,700. In determining its offer, Princeton noted the following pertaining to Streeter: • It holds a building with a fair value $44,900 more than its book value. • It has developed a customer list appraised…arrow_forwardsubject; accountingarrow_forward
- The statement of income for Pembina Ltd. is shown below: Sales Cost of goods sold Gross profit PEMBINA LTD. Statement of Income Year Ended December 31 (in millions) Operating expenses Income from operations Interest expense Income before income tax Income tax expense Net income 2021 $1,610 908 702 525 177 80 97 25 $72 2020 $1,410 744 PEMBINA LTD. Horizontal Analysis of Statement of Income (% of base-year amount) Year Ended December 31 666 407 259 50 209 52 $157 2019 $1,194 598 596 397 199 40 159 40 $119 Using horizontal analysis, calculate the horizontal percentage of a base-year amount, assuming 2019 is the base year. (Round answers to 1 decimal place, e.g. 5.2%. Enter negative amounts using either a negative sign preceding the number e.g. -45.1% or parentheses e.g. (45.1)%.)arrow_forwardThe following is a partial listing of accounts for XYZ, Inc., for the year ended December 31, 2020. Required: Prepare multiple step income statement for the year of 2020. Finished Goods Current Maturities of Long-Term Debt Accumulated Depreciation Accounts Receivable $ 38,872 2,515 19,960 Sales Revenue 6,273 127,260 Treasury Stock 251 Prepaid Expenses 2,199 Deferred Taxes (long-term liability) 8,506 Interest Expense 2,410 Allowance for Doubtful Accounts 915 Retained Earnings 18,951 Raw Materials 9,576 Accounts Payable 19,021 Cash and Cash Equivalents 8,527 Sales Salaries Expense 872 Cost of Goods Sold 82,471 Investment in Unconsolidated 3,559 Subsidiaries Income Taxes Payable 8,356 Work In Process 1,984 Additional Paid-In Capital 9,614 Equipment 41,905 Long-Term Debt 15,258 Rent Income 2,468 Common Stock 3,895 Notes Payable (short-term) 6,156 Income Tax Expense 2,461arrow_forwardThe following financial statements were extracted from the books of Alpha Ltd. and Omega Ltd. for the yearended 31 March 2023:Statement of profit or loss for the year ended 31 March 2023:Alpha Ltd. Omega Ltd.Sh.“million” Sh.“million”Revenue 1,699.815 2,058.96Cost of sales (1,171.045) (1,397.135)Gross profit 528.77 661.825Less: Operating expenses (354.775) (469.89)Net profit 173.995 191.935Less: Finance expenses (22.31) (31.625)Profit before tax 151.685 160.31Tax (36.8) (40.02)Profit for the year 114.885 120.29Statement of financial position as at 31 March 2023:Alpha Ltd. Omega Ltd.Non-current assets Sh.“million” Sh.“million”Land and building 414.00 586.5Furniture and fittings 100.65 104.88514.05 691.38Current assets:Inventories 680.80 463.45Trade receivables 202.86 370.185Bank 97.29 105.34980.95 938.975Total assets 1,495 1,630.355Capital and liabilities:Capital:Ordinary share capital 368.00 287.50Retained earning 422.74 718.29790.74 1,005.79Non-current liabilities:Bank loan 218.50…arrow_forward
arrow_back_ios
SEE MORE QUESTIONS
arrow_forward_ios
Recommended textbooks for you
 AccountingAccountingISBN:9781337272094Author:WARREN, Carl S., Reeve, James M., Duchac, Jonathan E.Publisher:Cengage Learning,
 Accounting Information SystemsAccountingISBN:9781337619202Author:Hall, James A.Publisher:Cengage Learning,
 Horngren's Cost Accounting: A Managerial Emphasis...AccountingISBN:9780134475585Author:Srikant M. Datar, Madhav V. RajanPublisher:PEARSON
 Intermediate AccountingAccountingISBN:9781259722660Author:J. David Spiceland, Mark W. Nelson, Wayne M ThomasPublisher:McGraw-Hill Education
 Financial and Managerial AccountingAccountingISBN:9781259726705Author:John J Wild, Ken W. Shaw, Barbara Chiappetta Fundamental Accounting PrinciplesPublisher:McGraw-Hill Education
Accounting
Accounting
ISBN:9781337272094
Author:WARREN, Carl S., Reeve, James M., Duchac, Jonathan E.
Publisher:Cengage Learning,
Accounting Information Systems
Accounting
ISBN:9781337619202
Author:Hall, James A.
Publisher:Cengage Learning,
Horngren's Cost Accounting: A Managerial Emphasis...
Accounting
ISBN:9780134475585
Author:Srikant M. Datar, Madhav V. Rajan
Publisher:PEARSON
Intermediate Accounting
Accounting
ISBN:9781259722660
Author:J. David Spiceland, Mark W. Nelson, Wayne M Thomas
Publisher:McGraw-Hill Education
Financial and Managerial Accounting
Accounting
ISBN:9781259726705
Author:John J Wild, Ken W. Shaw, Barbara Chiappetta Fundamental Accounting Principles
Publisher:McGraw-Hill Education