MATLAB: An Introduction with Applications
6th Edition
ISBN: 9781119256830
Author: Amos Gilat
Publisher: John Wiley & Sons Inc
expand_more
expand_more
format_list_bulleted
Question
thumb_up100%
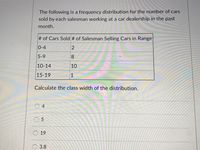
Calculate the class width of distribution.

Transcribed Image Text:The following is a frequency distribution for the number of cars
sold by each salesman working at a car dealership in the past
month.
# of Cars Sold # of Salesman Selling Cars in Range
0-4
2
5-9
8.
10-14
10
15-19
1
Calculate the class width of the distribution.
0 4
O 5
O 19
О 3.8
Expert Solution
This question has been solved!
Explore an expertly crafted, step-by-step solution for a thorough understanding of key concepts.
This is a popular solution
Trending nowThis is a popular solution!
Step by stepSolved in 2 steps with 2 images

Knowledge Booster
Similar questions
- Identify the lower class limits, upper class limits, Blood Platelet Count of class width, class midpoints, and class boundaries for the given frequency distribution. Also identify the number of individuals included in the summary. Males (1000 cells/uL) Frequency D 0-99 3 100-199 51 200-299 92 300-399 19 400-499 500-599 1 600-699 Identify the lower class limits (in 1000 cells/uL). (Type integers or decimals. Do not round. Use ascending order.)arrow_forwardWhat is a distribution of means and how it differs from a population distribution?arrow_forwardOne of the primary goals of constructing a frequency distribution for quantitative data is to summarize the data O by showing frequency of values that lie within a class or bin. O so that there are always 7 classes or bins of data. O ensuring that the classes or bins are always of different widths. O in a manner so that each class or bin has the same number of data points.arrow_forward
- For the residents in 2014, use R to calculate the interval with 99% certainty that the interval contains the actual population mean of the residents by census tracts. Type in the interval with keyboard. We also know that in each year, the number of residents by census tract in the State of Maryland follows a normal distribution, and the variance in the number of residents within the State of Maryland is the same for different years. POP2014: 3072, 1989, 3794, 2689, 3211, 3722, 4385, 4009, 7598, 3862, 3097, 2726, 4881, 4157, 2570, 2512, 2518, 4863, 4147, 7139, 6067, 6819, 3705, 3239, 3824, 4977, 2576, 2940, 9791, 5231, 5634, 5337, 4205, 3888, 5562, 3335, 3770, 1808, 2045, 1532, 5420, 4993, 6109, 4377, 5424, 4976, 4507, 3738, 2827, 3485, 1559, 5199, 4702, 3971, 3803, 3356, 4670, 3816, 5477, 4760, 3126, 3630, 3755, 3795, 2578, 3382, 4005, 2442, 6096, 3799, 3843, 3836, 6046, 6431, 3561, 3142, 4829, 5058, 2471, 6119, 3523, 3094, 3146, 3356, 2618, 2366, 4266, 4016, 6080, 1554, 6878, 3645,…arrow_forwardPlease help me with this homework questionarrow_forwardSuppose you compile all possible samples of 25 children of preschool age in your school district. If you calculate the mean of each sample (M) and create a frequency distribution of these means, this distribution is referred to as thearrow_forward
- Identify the lower class limits, upper class limits, class width, class midpoints, and class boundaries for the given frequency distribution. Also identify the number of individuals included in the summary. Age (yr) when award was won Frequency 5 -9 29 10 -14 34 15 -19 14 20 -24 4 25 -29 6 30 -34 2 35 -39 1 Identify the lower class limits. 5 ,10,15,20,25,30,35 (Type integers or decimals. Do not round. Use ascending order.) Identify the upper class limits. 9 ,14,19,24,29,34,39 (Type integers or decimals. Do not round. Use ascending order.) Identify the class width. 5 (Type an integer or a decimal. Do not round.) Identify the class midpoints. 7 ,12,17,22,27,32,37 (Type integers or decimals. Do not round. Use ascending order.) Identify the…arrow_forwardConstruct a frequency distribution using 8 classes (0-7) . Class limits Class boundaries Frequency 0 −0.5 - 0.5 1 0.5 - 1.5 2 1.5 - 2.5 3 2.5 - 3.5 4 3.5 - 4.5 5 4.5 - 5.5 6 5.5 - 6.5 7 6.5 - 7.5 Totalarrow_forwardA stemplot for a set of data is given below. What is the shape of the distribution? Stem Leaf 267 36 4228 5 1469 6 4589 7 225669 8 00112347899 9011223344456668889 10 155666777 11 1377 12 a. symmetrical b. skewed to the left c skewed to the right d. bimodal 1.arrow_forward
arrow_back_ios
arrow_forward_ios
Recommended textbooks for you
 MATLAB: An Introduction with ApplicationsStatisticsISBN:9781119256830Author:Amos GilatPublisher:John Wiley & Sons Inc
 Probability and Statistics for Engineering and th...StatisticsISBN:9781305251809Author:Jay L. DevorePublisher:Cengage Learning
 Statistics for The Behavioral Sciences (MindTap C...StatisticsISBN:9781305504912Author:Frederick J Gravetter, Larry B. WallnauPublisher:Cengage Learning
 Elementary Statistics: Picturing the World (7th E...StatisticsISBN:9780134683416Author:Ron Larson, Betsy FarberPublisher:PEARSON
 The Basic Practice of StatisticsStatisticsISBN:9781319042578Author:David S. Moore, William I. Notz, Michael A. FlignerPublisher:W. H. Freeman
 Introduction to the Practice of StatisticsStatisticsISBN:9781319013387Author:David S. Moore, George P. McCabe, Bruce A. CraigPublisher:W. H. Freeman

MATLAB: An Introduction with Applications
Statistics
ISBN:9781119256830
Author:Amos Gilat
Publisher:John Wiley & Sons Inc

Probability and Statistics for Engineering and th...
Statistics
ISBN:9781305251809
Author:Jay L. Devore
Publisher:Cengage Learning

Statistics for The Behavioral Sciences (MindTap C...
Statistics
ISBN:9781305504912
Author:Frederick J Gravetter, Larry B. Wallnau
Publisher:Cengage Learning

Elementary Statistics: Picturing the World (7th E...
Statistics
ISBN:9780134683416
Author:Ron Larson, Betsy Farber
Publisher:PEARSON

The Basic Practice of Statistics
Statistics
ISBN:9781319042578
Author:David S. Moore, William I. Notz, Michael A. Fligner
Publisher:W. H. Freeman

Introduction to the Practice of Statistics
Statistics
ISBN:9781319013387
Author:David S. Moore, George P. McCabe, Bruce A. Craig
Publisher:W. H. Freeman